
FIGURE 1.
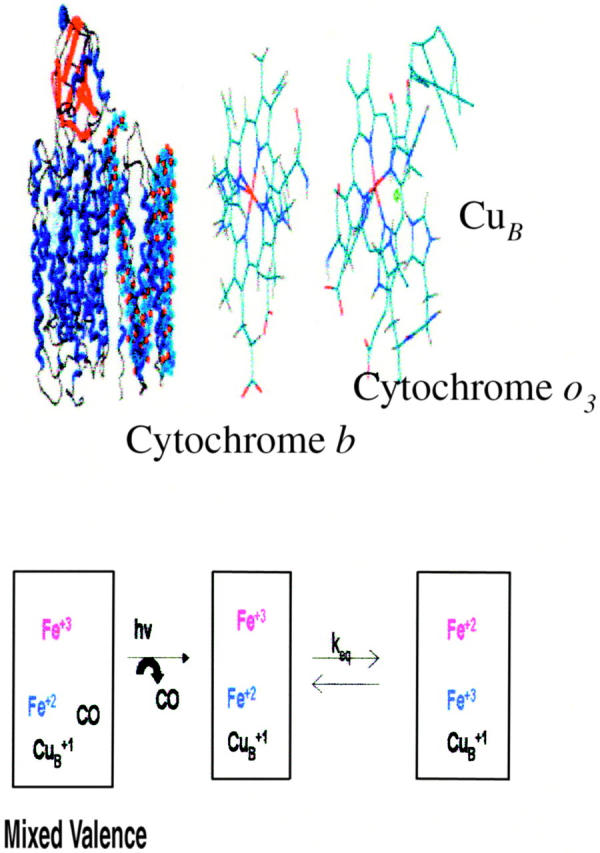
Structural diagram of Cytochrome bo3 from E. coli (top left) and the metal center orientation (top right). The bottom diagram describes the ET reaction being monitored subsequent to photolysis of the mixed valence derivative of the enzyme.
Official websites use .gov
A
.gov website belongs to an official
government organization in the United States.
Secure .gov websites use HTTPS
A lock (
) or https:// means you've safely
connected to the .gov website. Share sensitive
information only on official, secure websites.
Structural diagram of Cytochrome bo3 from E. coli (top left) and the metal center orientation (top right). The bottom diagram describes the ET reaction being monitored subsequent to photolysis of the mixed valence derivative of the enzyme.