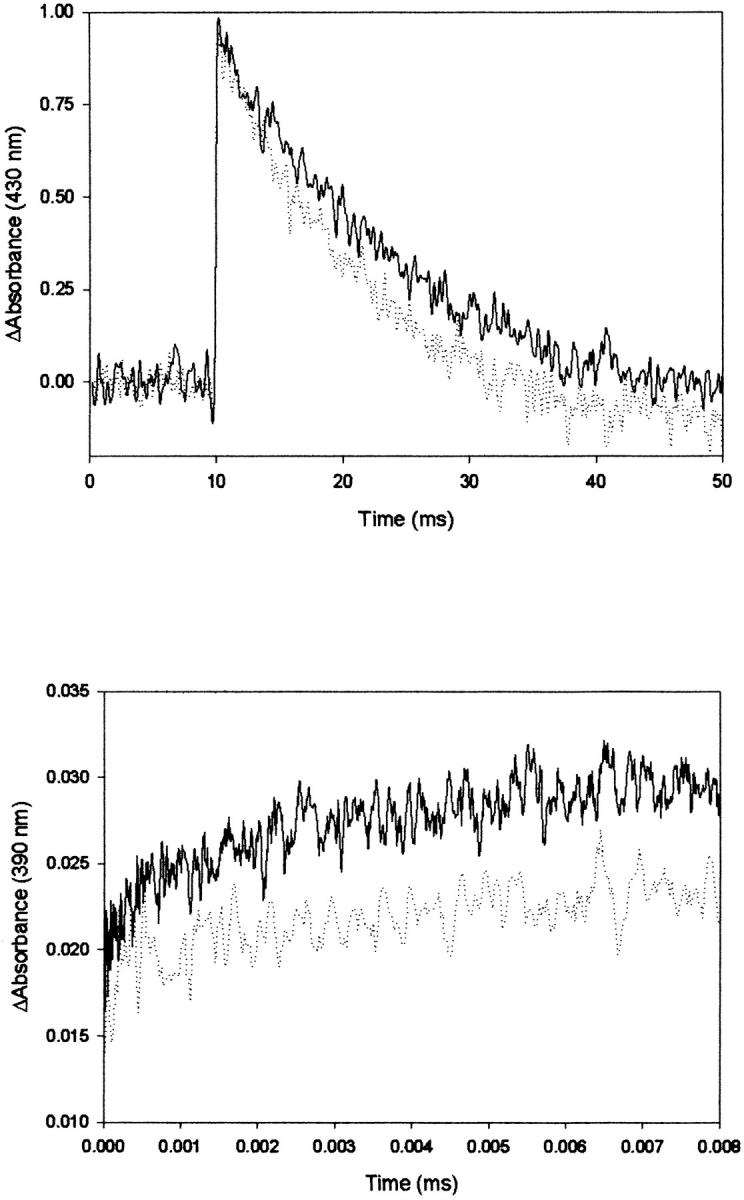
FIGURE 2.

Transient absorption data for the photolysis of the CO-mixed valence derivative of Cbo3. (Top) Traces obtained at 430 nm on a 50-ms timescale; solid line, 10°C; dashed line, 35°C. (Bottom) Traces obtained at 390 nm on a 25-μs timescale; solid line, 10°C; dashed line, 35°C. Sample concentration is ∼20 μM. Traces are the average of 25 laser pulses.
