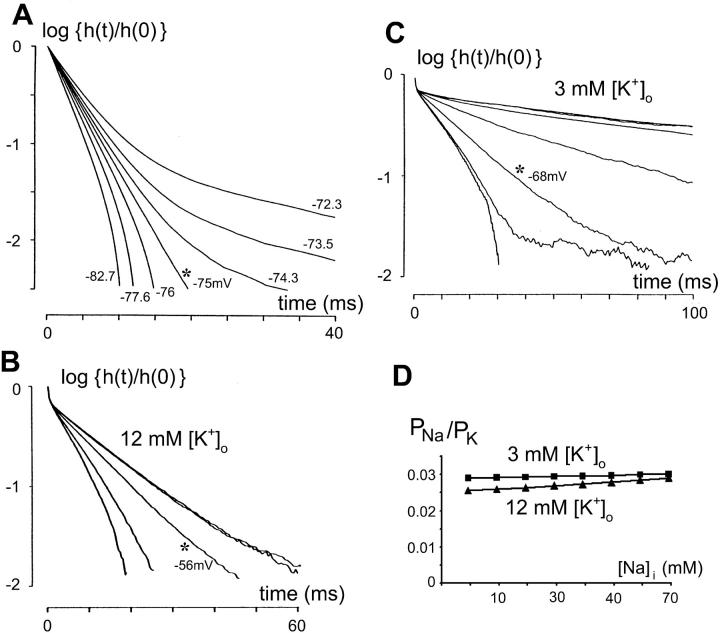
FIGURE 4.
Estimating the reversal potential of a hyperpolarization-activated channel from a family of impulse responses. (A) Computer simulation demonstrating the validity of the method for estimating the reversal potential of hyperpolarization-activated channel. Parameters of the model bipolar neuron for the simulation are listed in Table 2. The hyperpolarization-activated channel has a reversal potential of Eh = −75 mV. The impulse responses above and below the known reversal potential (−75 mV) are calculated as described in Methods and are plotted on the semilogarithmic scale. All the curves emanate from a common point and, in clockwise direction, these curves correspond to progressively more negative membrane voltage (in mV, −72.3, −73.5, −74.3, −75.0, −75.9, −77.6, and −82.7). At membrane voltages >−75 mV, the impulse response is concave; at voltages <−75 mV, impulse response is convex. Note that a transition between the two behaviors occurs precisely at the membrane potential equal to the reversal potential Eh −75 mV, at which the slope of the impulse response becomes a straight line (asterisk). (B) The method in panel A applied to the impulse responses for mean currents of 0 pA, 0 pA (repeated, two nearly overlapping curves), −3 pA, −15 pA, −25 pA, recorded from a bipolar cell in solution C (12 mM [K+]o). The impulse response is concave (capacitive) for 0 pA and turns convex (inductive) between −3 pA and −15 pA. The membrane potential at the transition (asterisk), ∼−56 mV, is read from the V-I curve (not shown) at the point corresponding to −3 pA, and taken as an estimate of the reversal potential of the hyperpolarization-activated channel. (C) The method in panel A applied to the impulse responses for mean currents of 0 pA, 0 pA (repeated, two nearly overlapping curves), −3 pA, −7 pA, −15 pA, −25 pA, −25 pA (repeated), recorded from another bipolar cell in solution A (3 mM [K+]o). The impulse response is concave (capacitive) for 0 pA, −3 pA, −7 pA, and turns convex (inductive) between −15 pA and −25 pA. The membrane potential at the transition (asterisk), ∼−68 mV, is read from the V-I curve (not shown) at −15 pA and taken as an estimate for the reversal potential of the hyperpolarization-activated channel. Note the convexity of the two traces for −25 pA is judged from the smooth portion of the curves at time <30 ms. The trace to the right contains much noise and has an amplitude that has decreased by more than one order of magnitude at times >40 ms. The portion corrupted by noise was ignored in the analysis of curvature. (D) The permeability ratio for Na+ vs. K+ (PNa+/PK+) for a range of [Na]i (3–70 mM) is calculated as described in text. The average of the 14 reversal potentials of the hyperpolarization-activated channel under 3 mM [K+]o was used for estimating PNa+/PK+ at that ionic condition. Similarly, average of 16 reversal potentials was used for PNa+/PK+ estimation for 12 mM [K+]o condition.

