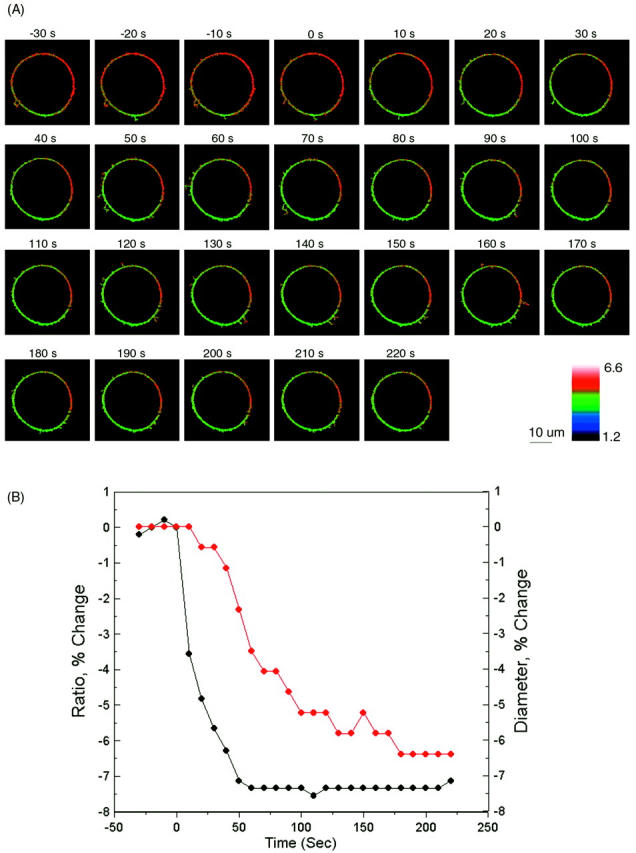
FIGURE 7.

Visualizing the effect of calcium on intramembrane potential with di-8-ANEPPS in N1E-115 neuroblastoma cells. (A) At time = 0, 2 mM Ca was externally applied to the bathing medium (initially containing 0 mM Ca) of a cell stained with di-8-ANEPPS. The 440-nm/530-nm fluorescence ratios are displayed in pseudocolor. (B) The time-dependent change in surface potential does not parallel the change in cell diameter. The changes in 440-nm/530-nm ratio (black) and cell diameter (red) are both calculated relative to values before the addition of Ca. The relative changes in intramembrane potential were calculated from the calibration Equation: 
