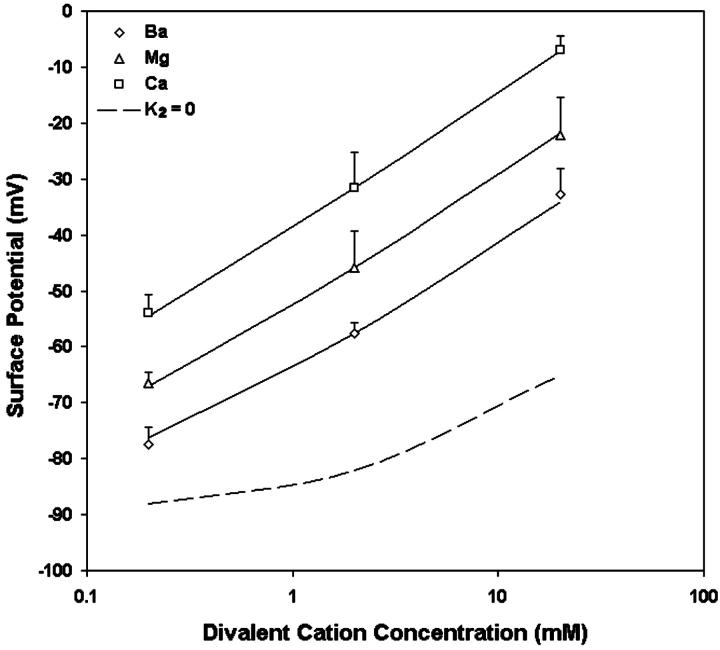
FIGURE 8.
The effect of Ba (open diamonds), Mg (open triangles), and Ca (open circles) on the intramembrane potential of N1E-115 neuroblastoma cells. Each point represents the mean of the surface potential measurements of six to nine cells. The curves are the theoretical predictions of the Stern equation using the values of all parameters in Table 4. For reference, the dashed line is the theoretical prediction for surface potential with K2 = 0.

