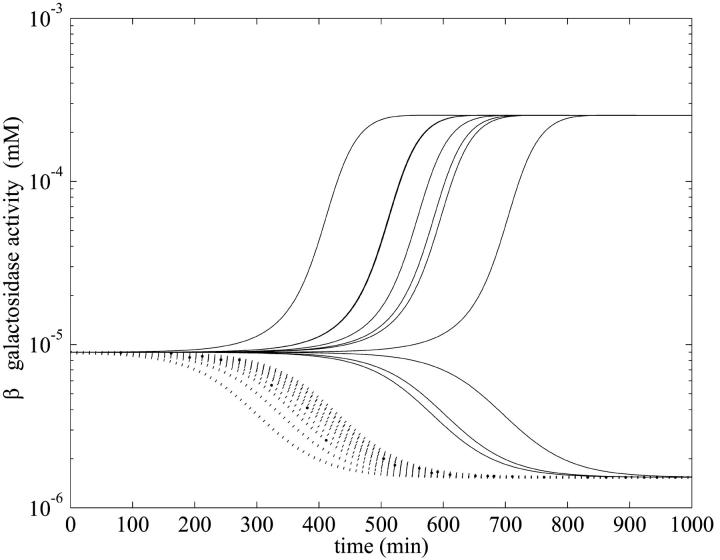
FIGURE 6.
Semilog plot of β-galactosidase activity versus time showing effects of selection of the initial condition for t ∈[−τ, 0] in the numerical simulation with the parameters of Table 1 and various initial values of mRNA and allolactose oscillating around the unstable steady-state values corresponding to the middle branch of Fig. 2 when  and Le = 4.0 × 10⁻² mM (which is in the range of lactose concentration for coexistence of three steady states). The solid lines show the β-galactosidase activity when the initial allolactose functions are
  (n = 1, 2, …10), t ∈[−τM, 0], and the other variables are at the steady-state values on the middle branch. (Here
  is the unstable steady-state value of A on the middle branch). The dotted lines depict the temporal changes in β-galactosidase activity when
  (n = 1, 2, …10) for t ∈[−(τB + τP),0]. Again all the other variables are at the steady-state values when Le = 4.0 × 10⁻² mM and
  is also the steady-state value of A on the middle branch. The steady-state values are
  ,
,  ,
,  ,
,  , and
, and  , when Le = 4.0 × 10⁻² mM.

