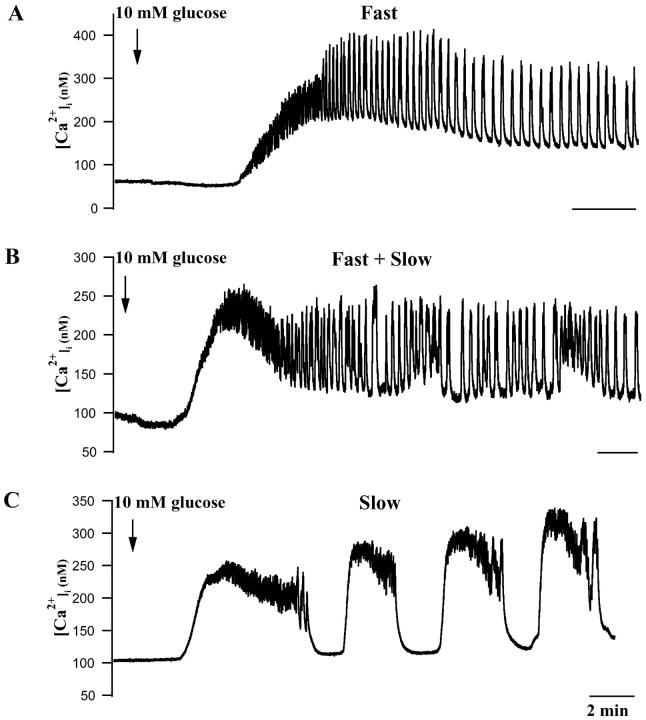
FIGURE 1.
[Ca2+]i responses of individual mouse islets to changing glucose from 0 to 10 mM. (A) Representative islet exhibiting mainly fast phase 2 oscillations. (B) Islet showing a mixture of fast and slow [Ca2+]i oscillations. (C) Islet showing primarily slow [Ca2+]i oscillations. Initial islet [Ca2+]i changes often included initial decreases, a plateau phase, and then oscillations (see text). All time bars represent 2 min.

