
FIGURE 5.

Steady-state CheY-P concentration [YP] versus ligand occupancy rate L for breaking condition 4 for three sets of parameters. The results are obtained by increasing one of the four ratios of catalytic rates (see text for definition) by a factor of 2: rn = 2rref = 0.38, while keeping the other three ratios unchanged at the reference value of 0.19. The four different line types correspond to n = 1, 2, 3, and 4, respectively. In addition to the reference parameters (middle curves), two more sets of parameters are used, with  (upper curves) and
  (lower curves). For the reference parameters, violation of condition 4 with n = 2 has the largest effect. For the new systems with higher
  and lower
 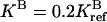 activities, the effect of violating condition 4 is more severe at a larger (n = 4) and a smaller (n = 1) methylation level, respectively, because of the changes in the receptor population distribution.