FIGURE 5.

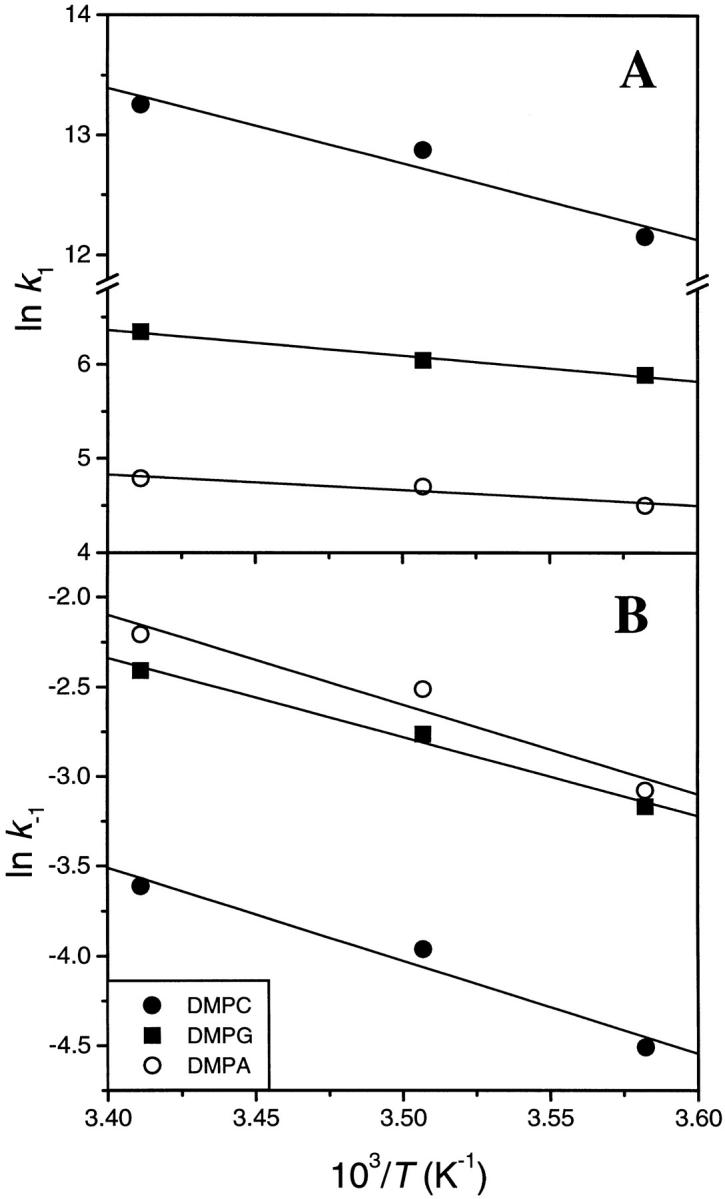
Plots of ln (k/T) versus (1/T) for the association (A) and dissociation (B) rate constants. The data from SPR experiments carried out at different temperatures with DMPC, DMPG, and DMPA containing 20% (wt/wt) cholesterol are shown.

Plots of ln (k/T) versus (1/T) for the association (A) and dissociation (B) rate constants. The data from SPR experiments carried out at different temperatures with DMPC, DMPG, and DMPA containing 20% (wt/wt) cholesterol are shown.