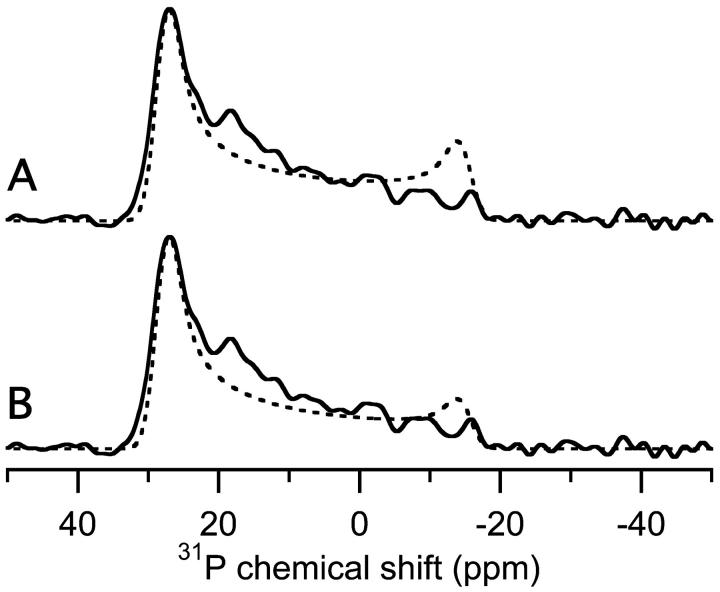
FIGURE 7.
The comparison of the experimental 5% MSI-78 in POPC (Fig. 5 C) spectrum (solid line) with simulated spectra (dashed line). The parameters used for the simulations were σ‖ = 28 ppm, σ⊥ = −15 ppm, and line broadening of 1.5 ppm. Using the notation of Fig. 6, the simulations used (A) b = 20 Å and a = 10 Å, and (B) b = 20 Å and a = 5 Å. The experiments were performed at 30°C.

