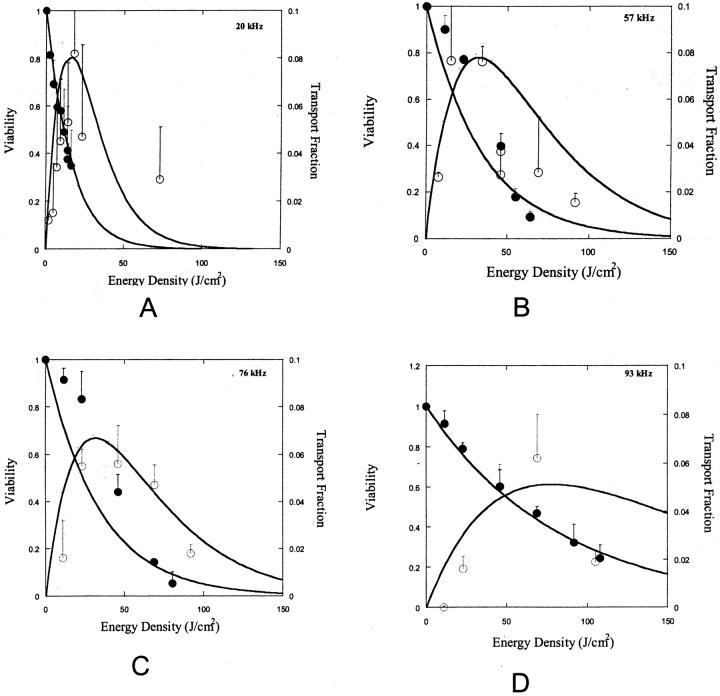
FIGURE 7.
(A–D) Experimental data on viability of 3T3 cells at four frequencies and various energy densities between 0 and 150 J/cm2 (A: 93 kHz, B: 76 kHz, C: 57 kHz, and D: 20 kHz). ○ corresponds to transport fraction and • corresponds to viability. Error bars correspond to standard deviation (based on at least four repetitions). Lines correspond to fits of Eq. 13 for viability data and Eq. 14 for transport data. Eqs. 13 and 14 fitted to viability and transport data with average r2 values of 0.9 and 0.1, respectively. The estimated errors in fitted parameters (λκ and μκ) were lower than 20%.

