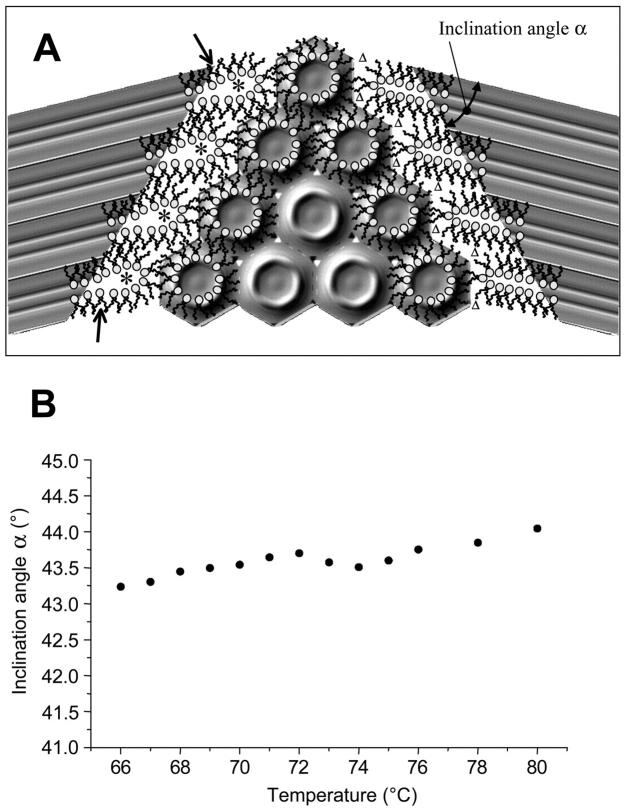
FIGURE 7.
(A) Sketch of the interface between the Lα and HII phases at the transition midpoint (TH = 74°C). For both phases, the electron density maps have been calculated using the amplitudes given in Tables 1 and 2, respectively (refer to Fig. 2 C). Since the two lattices are not commensurate, the inclination, α, between them differs clearly from 60°. On the left-hand side, the interface region has been filled with lipid molecules in such a way that the interstitial regions are minimized. Creation of water cores is indicated by asterisks. On the right-hand side, the lipid molecules are restricted to permit only negative curvature at the polar interface, but automatically the interstitial regions enlarge (Δ). (B) Inclination angle (•) plotted as a function of temperature.

