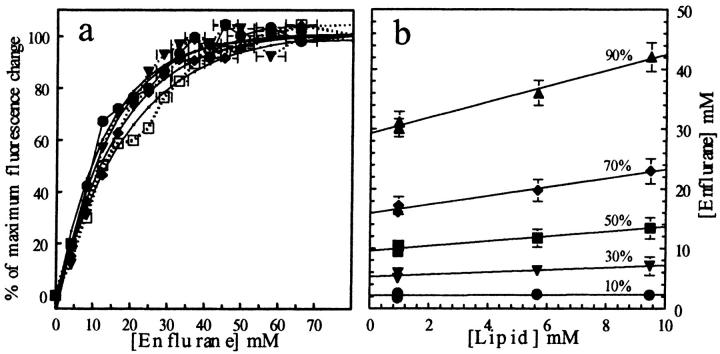
FIGURE 10.
(a) Fluorescence changes of Laurdan (expressed in percent of maximal change) as a function of [enflurane] at 45°C. The curves correspond to DPPC concentrations of 0.9 (•), 1 (▾), 5.7 (♦), and 9.7 (□) mM. (b) Relation between the enflurane concentrations required to reach 10, 20, 50, 70, and 90% of the fluorescence changes as a function of lipid concentration (see Table 4 and text for details).

