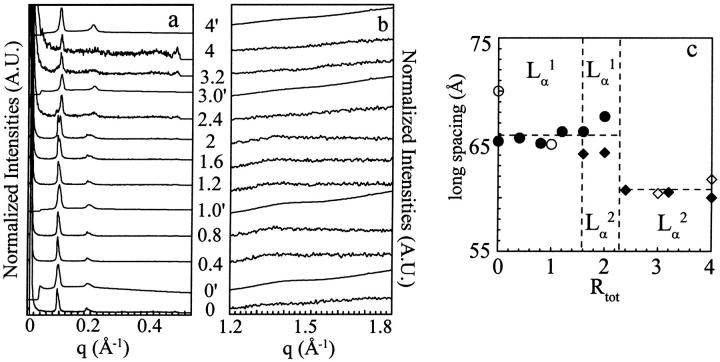
FIGURE 4.
SAXS (a) and WAXS (b) patterns at 45°C on different DPPC-enflurane mixtures. The Rtot are indicated at the level of each trace. The superscript prime identifies traces measured on D43 line ([lip] = 61 mM). The others are those measured on D22 line ([lip] = 100 mM). (c) Long spacing as a function of Rtot. Unfilled and solid symbols correspond to measurements on D43 and D22 lines, respectively. (Circles and diamonds stand for Lα1 and Lα2 phases, respectively.)

