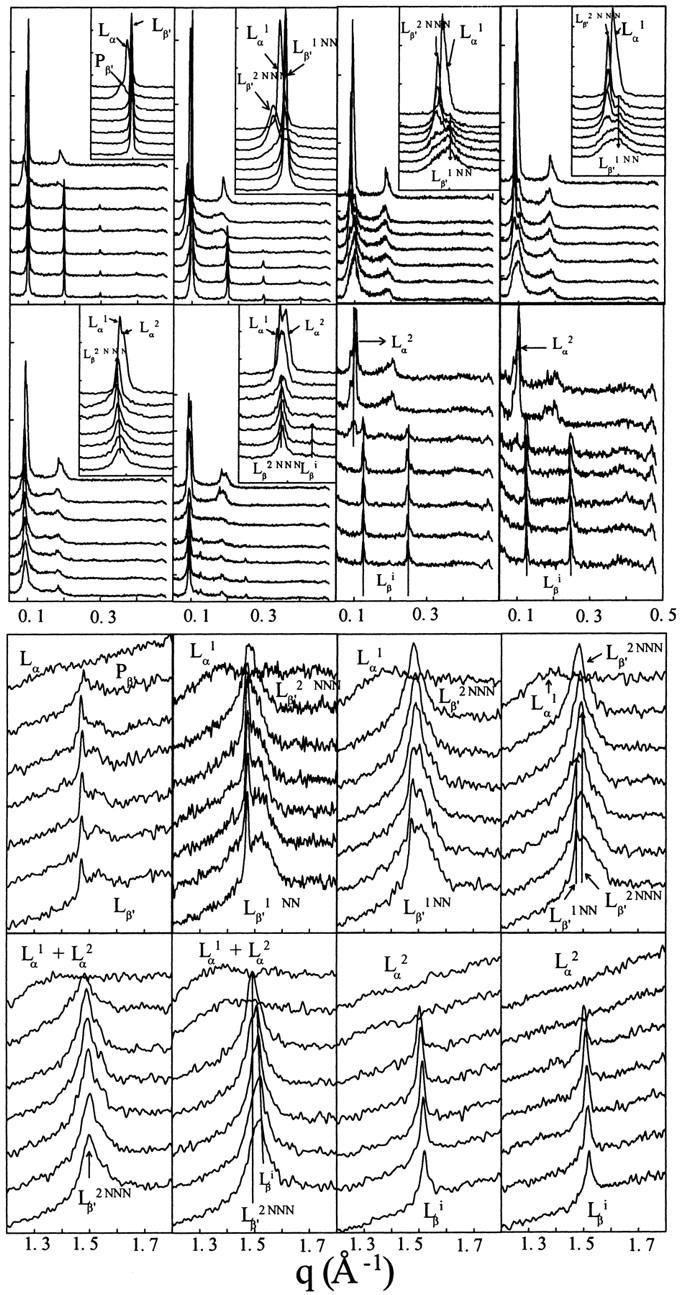
FIGURE 6.

SAXS (upper panels) and WAXS (lower panels) patterns of different enflurane/DPPC mixtures at different Rtot and temperatures. In both groups of panels, from left to right and top to bottom, the Rtot of the samples are 0, 0.4, 0.8, 1.2, 1.6, 2, 2.4, and 3.2. In each set of traces, the curves, from bottom to top, correspond to measurements at 15, 20, 25, 30, 35, 40, and 45°C. In some cases, inserts present a zoom on the first order of the Bragg peak to evidence coexistence of different lamellar structures.
