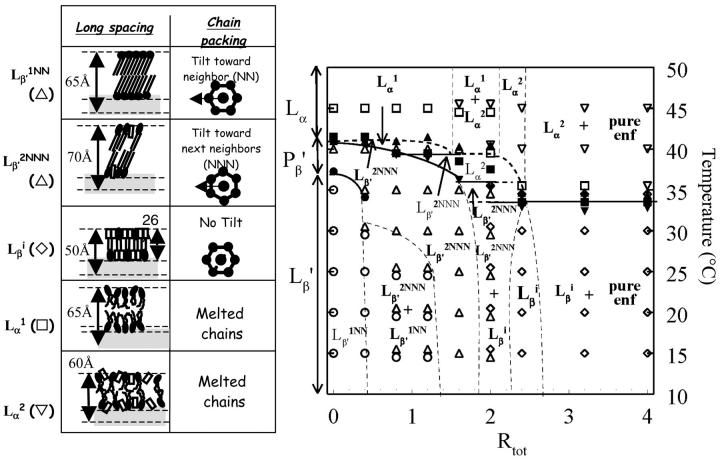
FIGURE 7.
Pseudobinary phase diagram built from x-ray and DSC data. The thermal events are represented by closed symbols whereas open symbols represent specific phases. The abscise of the phase diagram is the Rtot of the samples. ▾, Ton of the main transition; ▴, Toff of the main transition; ▪, chain melting temperature measured on WAXS patterns; and •, Ton of the Lβ′–Pβ′ transition. The structural information and symbolic representation of the different specific phases are given on the left of the diagram.

