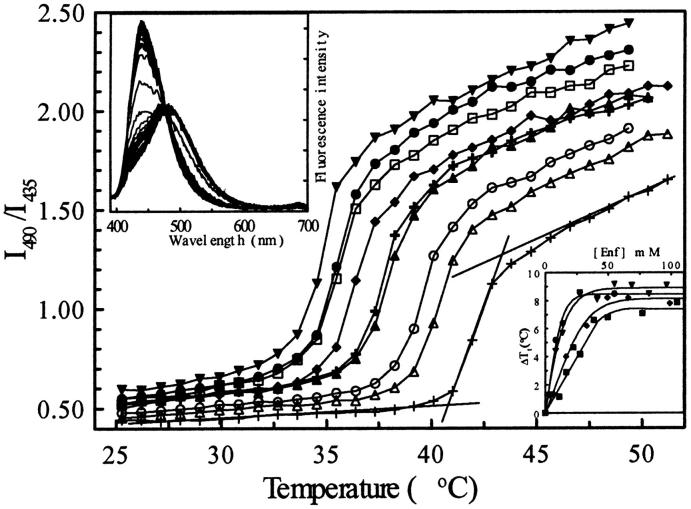
FIGURE 8.
Evolution of the fluorescence intensity ratio I490/I435 of Laurdan. The different curves were obtained at constant [DPPC] = 0.85 mM and enflurane concentrations of 0 (+); 8.2 (▵); 13.7 (○); 27.5 (▴); 41.2 (+); 54.9 (♦); 68.7 (□); 82.4 (•); and 96.1 (▾) mM. The transition temperature is determined by the graphic tangent method as indicated on the figure for the curve obtained for pure DPPC liposomes. (Upper inset), Emission spectra of Laurdan (λex = 370 nm) during an increase of temperature from 25 to 48°C at 0.22°C/min ([DPPC] = 0.85 mM and [Enf] = 13.7 mM). (Lower inset) Enflurane concentration-dependent shift of the Ton obtained from the fluorescence experiment at lipid concentrations of 1 mM (•), 2 mM (▾), and 7 mM (♦), and from DSC (▪, [Lip] = 20.3 mM).

