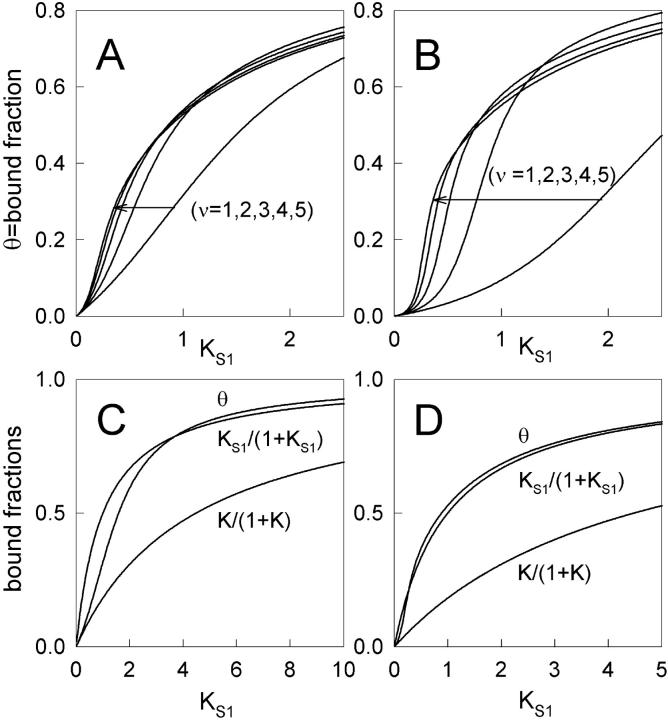
FIGURE 4.
The fraction θ of actin sites occupied by myosin-S1 as a function of first-order myosin affinity KS1, as predicted by Eq. 20. Graphs A and B show binding curves for kink energies  and 3kBT respectively; plots selected along the arrow from right to left are in increasing order of the persistence number ν. Graphs C and D show the above curves for ν = 1 and 5 respectively, and
  accompanied by the hyperbolic curves K/(K + 1) and KS1/(KS1 + 1) for independent binding in the presence and absence of inhibition. The crossover effect is discussed in the main text.

