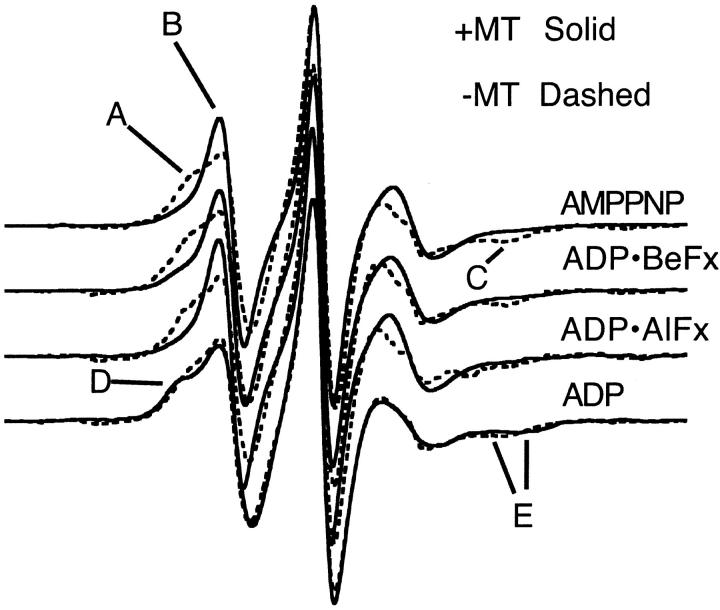
FIGURE 2.
EPR spectra of MSL-labeled KS188C taken at 20°C in the presence and absence of microtubules. The horizontal axis is magnetic field (width = 12.7 mT), the vertical axis is the derivative of absorption. The top three spectra are in the presence of 5 mM ATP analog. The bottom spectra are in the presence of ADP. Locations A–C in the top three spectra, and locations D and E in the ADP spectrum, are discussed in the text. All spectra (Figs. 2–5) are normalized with respect to the central peak height to enhance the visual display of spectral differences in the low-field region.

