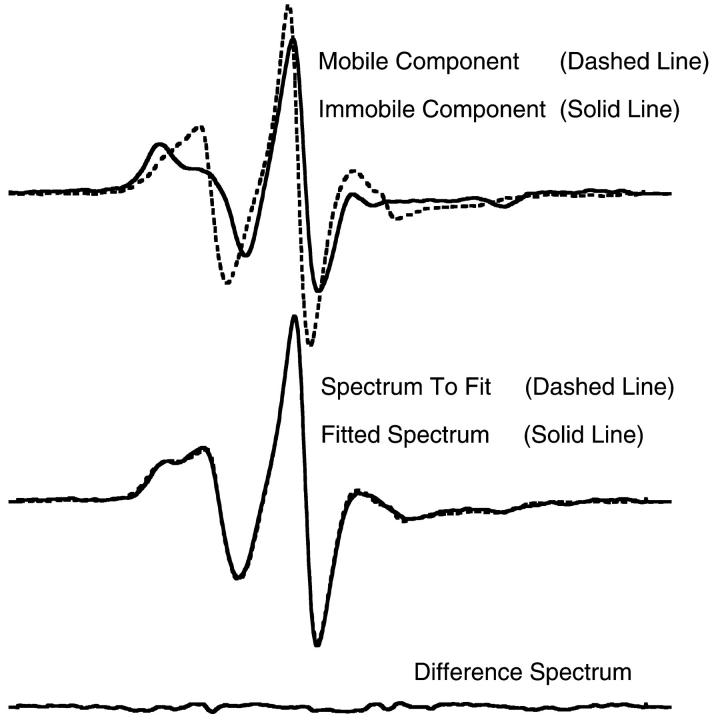
FIGURE 6.
(Top) EPR spectra of MT•MSL-KS188C•ADP at 2°C (solid line) and MSL-KS188C•ADP at 30°C (dashed line), taken as the immobile and mobile components of the spectra of MT•MSL-KS188C•ADP as a function of temperature. (Middle) Spectrum of MT•MSL-KS188C•ADP at 15°C (dashed line) and the fit (solid line) as a linear combination of the spectra in top panel. (Bottom) Difference spectrum for spectra in middle panel.

