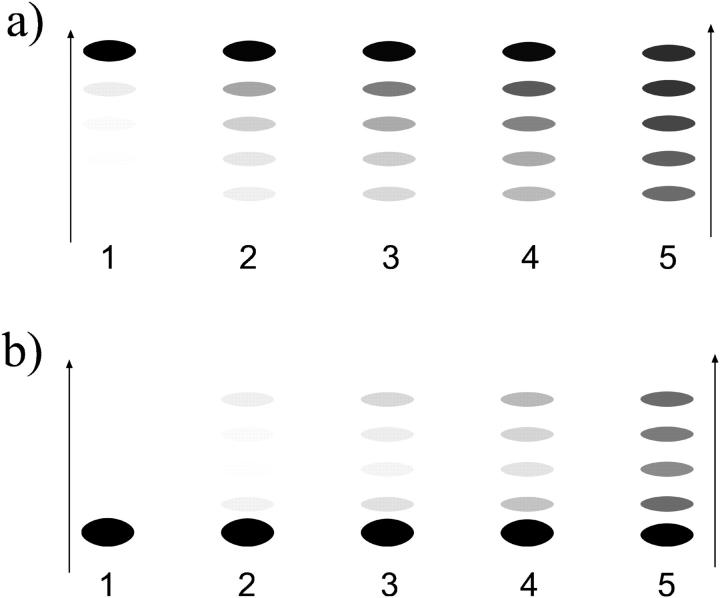
FIGURE 8.
Typical (one-dimensional) gel electrophoresis signatures expected for the relaxation dynamics of the two species from Fig. 7: (a) nucleosome starts from an end, and (b) from the middle position. Lanes 1–5 correspond to incubation times (1, 5, 10, 20, 100) × 108  respectively. Note that the population of distant bands in b, lanes 2–4 occurs first, in sharp contrast to what we expect from a simple (local) diffusive behavior.

