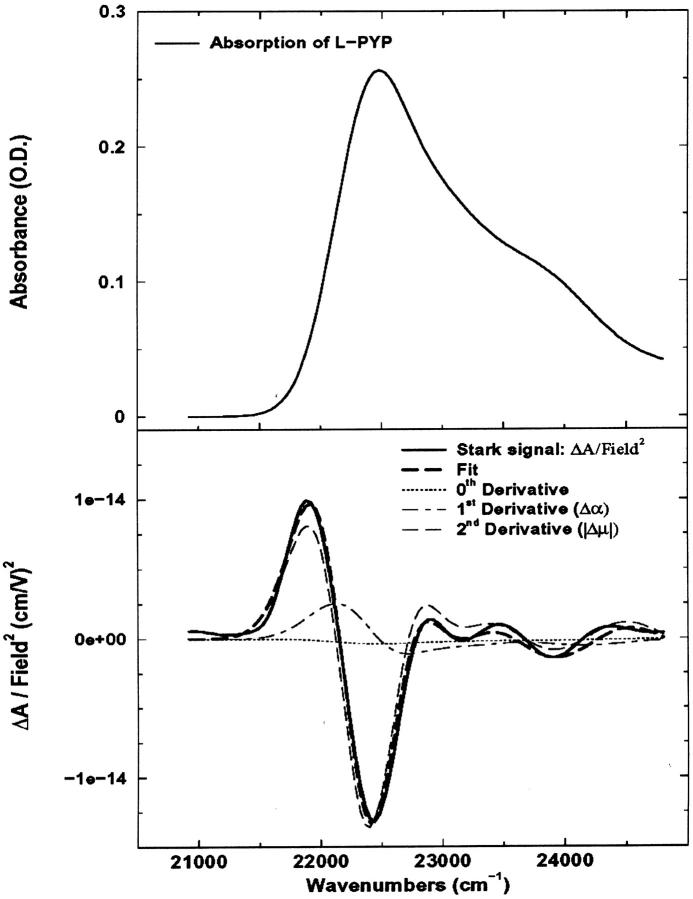
FIGURE 5.
(a) Absorption spectra of L-PYP in Tris-HCl buffer: glycerol (54:46 v:v) at 77 K (dark solid line). (b) The electroabsorption spectra (dark solid line) and fit (dark dot-dashed line) to the absorption spectrum (dark solid line in a) are shown along with the individual contributions of the zeroth (light dotted), first derivative (light dashed), and second derivative (light dot-dashed) components of the absorption spectrum.

