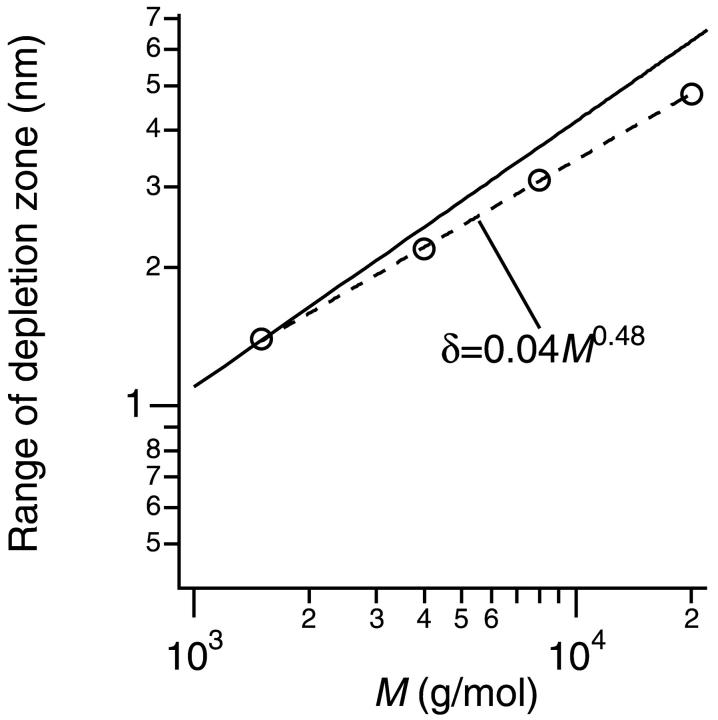
FIGURE 6.
The range of depletion zone δ obtained from the fitting as shown in Fig. 5 versus the molecular weight M of PEG. The broken line was a fitting using a power law function, δ ∼ Mα. The solid line represents the relation between the radius of gyration rg and the molecular weight M of PEG (Kawaguchi et al., 1997), rg = 0.020 M0.58.

