
FIGURE 1.
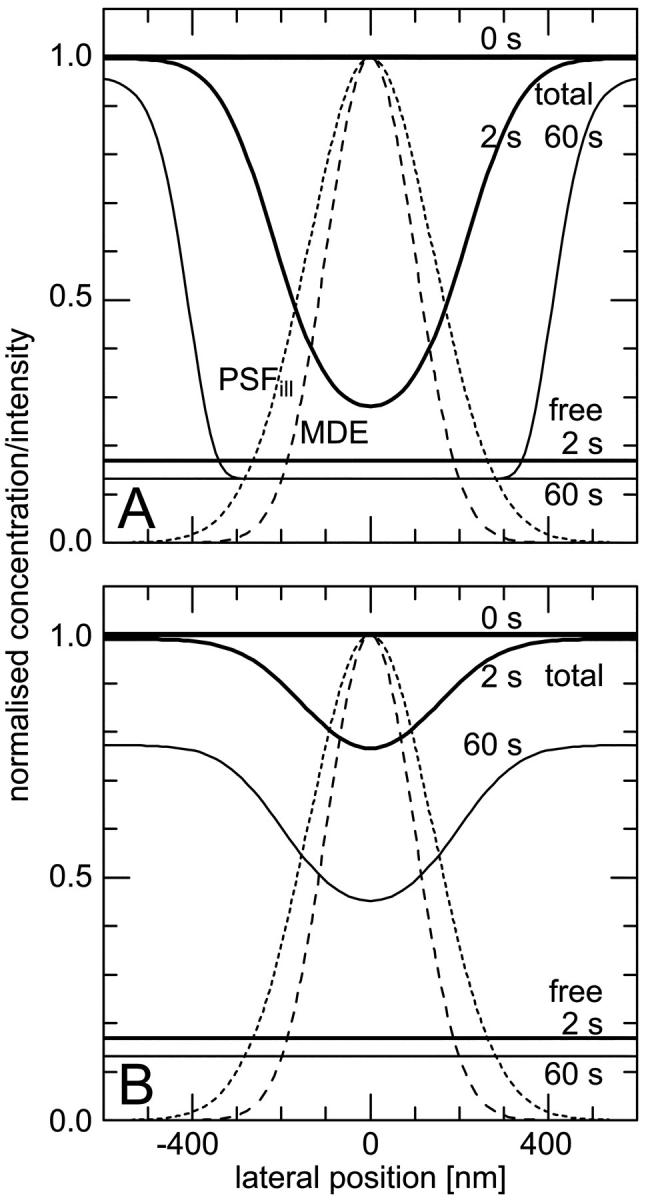
Lateral profiles of the illumination PSF, of the MDE, and of the concentrations of fluorescent molecules in the focal plane during CP experiments. (Dotted lines) Gaussian PSFill with a 1/e2-radius of 280 nm; (dashed lines) Gaussian MDE with a 1/e2-radius of 200 nm; (solid lines) concentration of the total amount and of the freely mobile fraction of fluorescent molecules directly before (0 s), shortly after starting (2 s), and after bleaching (60 s) for different sets of parameters: (A)  ,
,  , and
, and  , i.e., without exchange, (B)
  ,
,  , and
, and  , i.e., with a medium dissociation rate.