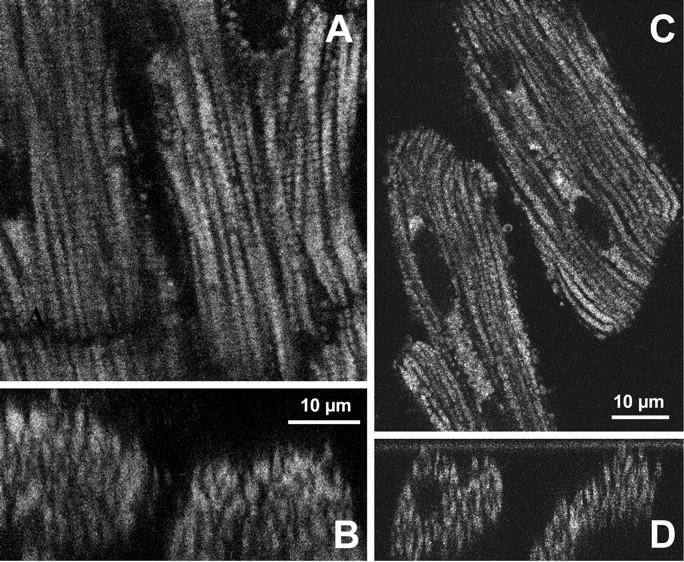
FIGURE 1.

(A) Confocal image of mitochondrial flavoproteins autofluorescence in skinned cardiac fibers. Note the very regular intracellular arrangement of mitochondria between myofibrils. The diffusion distance from medium to core of cells is ∼10 μm, and apparent Km for exogenous ADP is 250–350 μM (see the text). (B) Corresponding cross section showing the distribution of mitochondria in Z-plan of the permeabilized fibers from control rat heart. A decline in signal intensity visible as a function of fiber depth is a consequence of the laser light absorption and scattering by the tissue, and is not due to the heterogeneity of oxidized state. Notice good separation of the fibers from each other. (C) Confocal image of mitochondrial flavoproteins autofluorescence in permeabilized isolated cardiac cells. Note very regular intracellular arrangement of mitochondria between myofibrils. The diffusion distance from medium to core of cells is 5–10 μm, and apparent Km for exogenous ADP is 200–300 μM (Kummel, 1988; Kay et al., 1997). (D) Corresponding cross section showing the distribution of mitochondria in Z-plan of the permeabilized cardiac cells from control rat heart.
