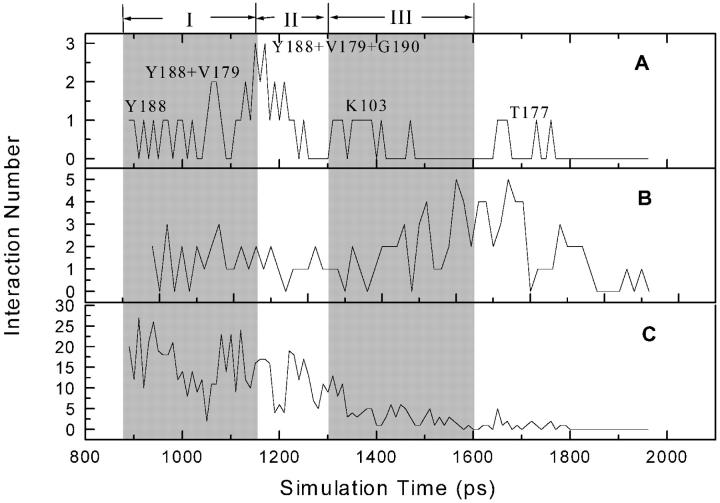
FIGURE 5.
Variations of the numbers of direct hydrogen-bonding interactions (A), water-bridged interactions (B), and hydrophobic interactions (C) between α-APA and HIV-1 RT in the SMD simulation. Regions I, II, and III denote the three phases in the unbinding process of α-APA from the inhibitor-binding pocket. The calculation of interactions is recorded every 10 ps.

