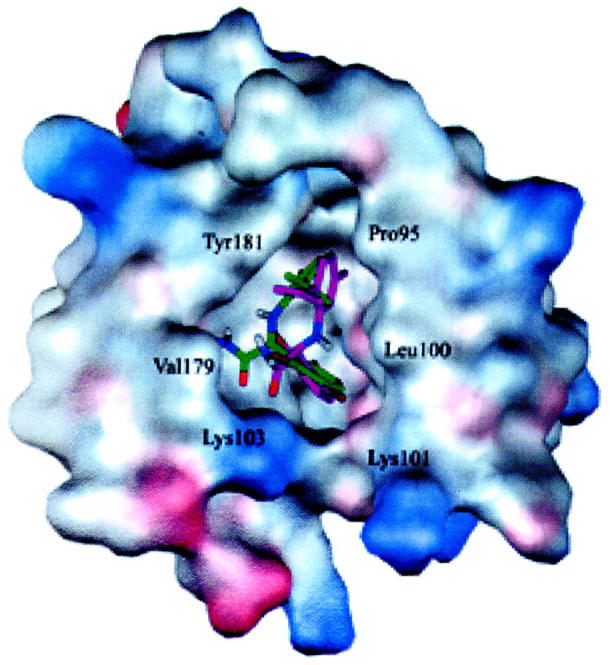
FIGURE 7.

Structures of the HIV-1 RT/α-APA complex before α-APA passes through the bottleneck of the entrance (at 1250 ps, green) and right after α-APA crosses over the bottleneck of the entrance (at 1280 ps, pink). The inhibitor-binding pocket is represented by the electrostatic potential surface. This picture was generated using WebLab ViewerPro program (MSI, 1998) and then rendered using the POV-Ray program (Pov-Ray-Team, 1999).
