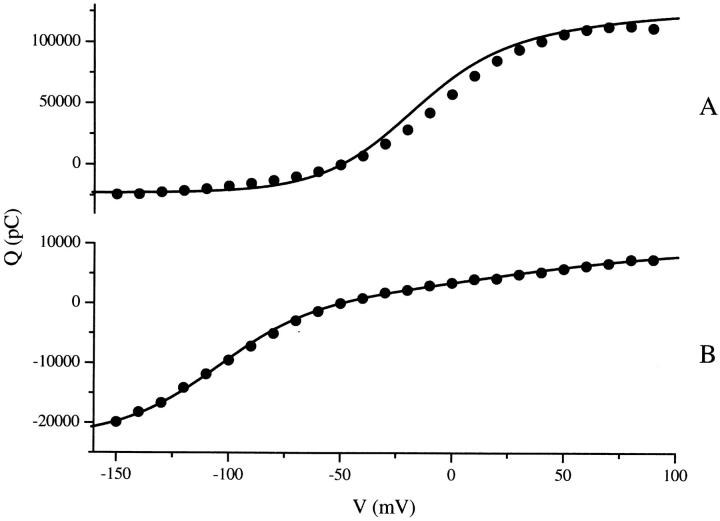
FIGURE 11.
Experimental and predicted Boltzmann distributions. Experimental Boltzmann distributions (solid circles) were calculated by integrating (from 0 to 150 ms) baseline-adjusted (between t = 145 to 150 ms) transient currents produced from a ramp protocol similar to the one shown in Fig. 3. To increase the signal-to-noise ratio, Boltzmann curves from each oocyte were summed to create the Boltzmann distributions shown here. (A) n = 18 for 100 mM Na+, and (B) n = 4 for 10 mM Na+. Simulated Boltzmann distributions (solid line) were calculated using the parameter values in Table 2 and then scaled to match the amplitude of the experimental curves.

