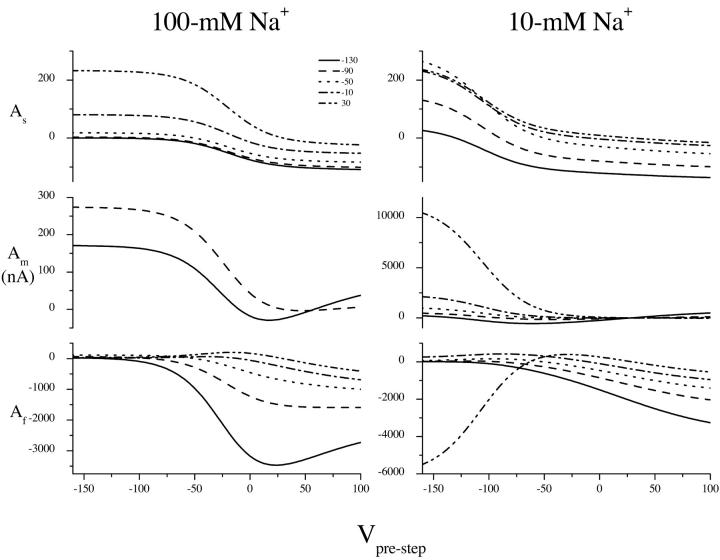
FIGURE 12.
Predicted amplitude trends using the solution in Table 2. The form of the predicted amplitude curves match the experimental ones in Fig. 8. Amplitudes are shown as a function of the prestep potential from −150 to 90 mV and for poststep potentials of −130 (solid), −90 (dashed), −50 (dotted), −10 (dash dot), and 30 mV (dash dot dot).

