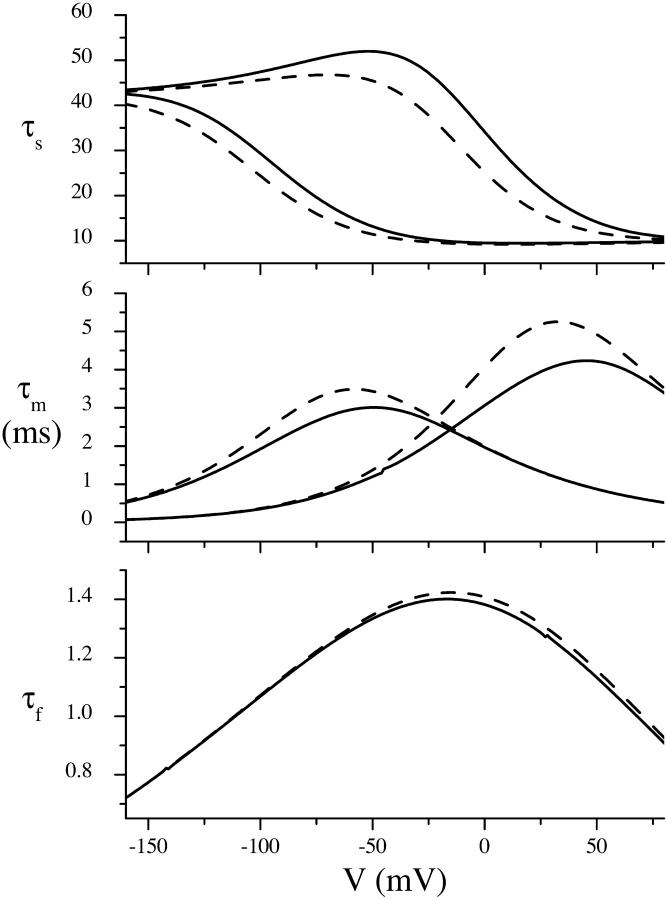
FIGURE 13.
Comparison of time constants predicted by the general (solid line) and fast–slow–fast (dashed line) four-state system using the solution in Table 2. τ versus V curves of the general model were found by solving for the eigenvalues of the system of equations in Eq. 1. Time constants of the fast–slow–fast system were calculated from Eq. 6.

