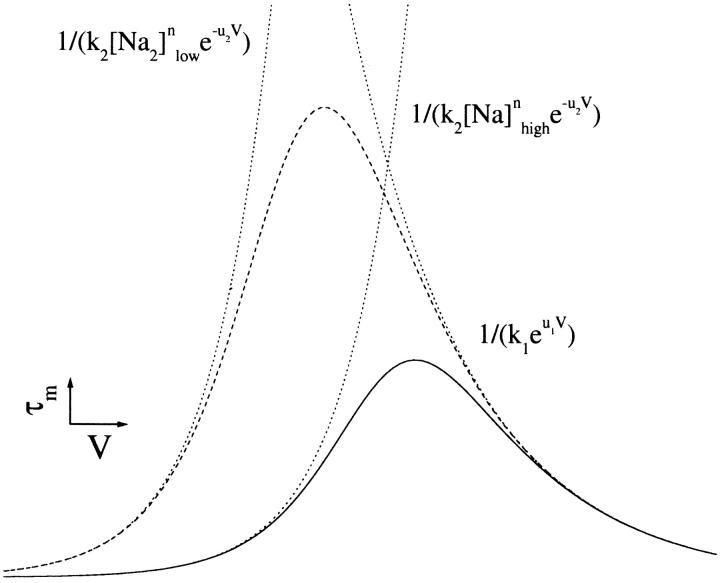
FIGURE 14.
Graphical representation of Eq. 7. Theoretical plot of the Na+ concentration and voltage-dependent behavior of the time constant associated with an isolated Na+ binding/debinding transition at high (solid line) and low (dashed line) Na+ concentrations. Note that at extreme hyperpolarizing and depolarizing potentials, τ approaches the reciprocal of one of the exponential terms in the denominator of Eq. 7 (dotted line). As the Na+ concentration is decreased (for any n ≥ 1), one of the exponentials shifts to the left, and the peak of τ shifts up and toward hyperpolarizing potentials.

