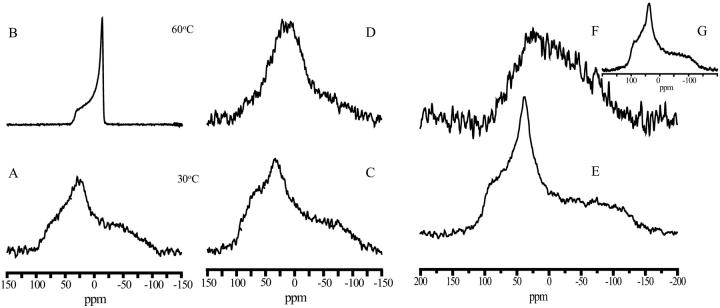
FIGURE 3.
31P NMR spectra of DMPC in the absence or presence of levan or dextran. Spectra were obtained at two different temperatures as shown in the figure. The lipid/polysaccharide mass ratio was 1:2. Spectra were recorded at 30°C using CP and at 60°C using SE technique. (A) DMPC at 30°C, (B) DMPC at 60°C, (C) DMPC/Levan at 30°C, (D) DMPC/Levan at 60°C, (E) DMPC/Dextran at 30°C, and (F) DMPC/Dextran at 60°C. The inset (G) shows the CP spectrum.

