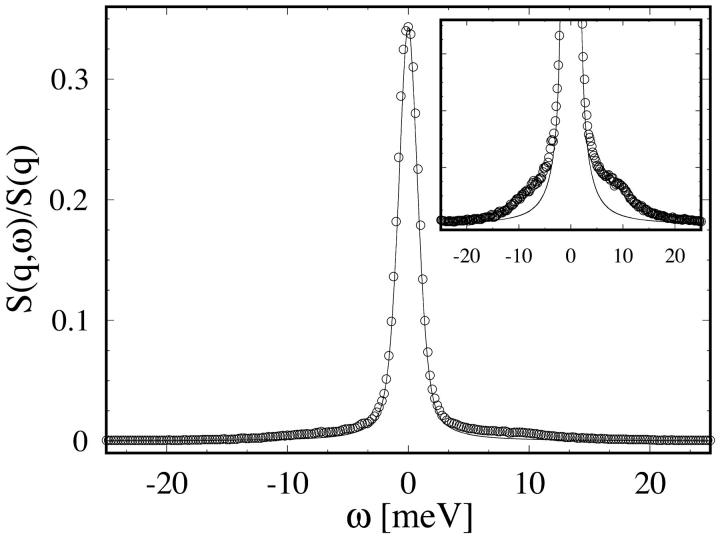
FIGURE 1.
IXS spectrum of pure DMPC at T = 290 K and q = 7.5 nm−1. The continuous line depicts the instrumental resolution function of the spectrometer, fitted by Eq. 1 with Γ = 1.90, η = 0.50. The spectrum is dominated by the elastic line at ω = 0. The inset shows the same plot with the y-axis enlarged by a factor of 10. The intensity of the side-peaks is roughly two orders-of-magnitude smaller than the central peak.

