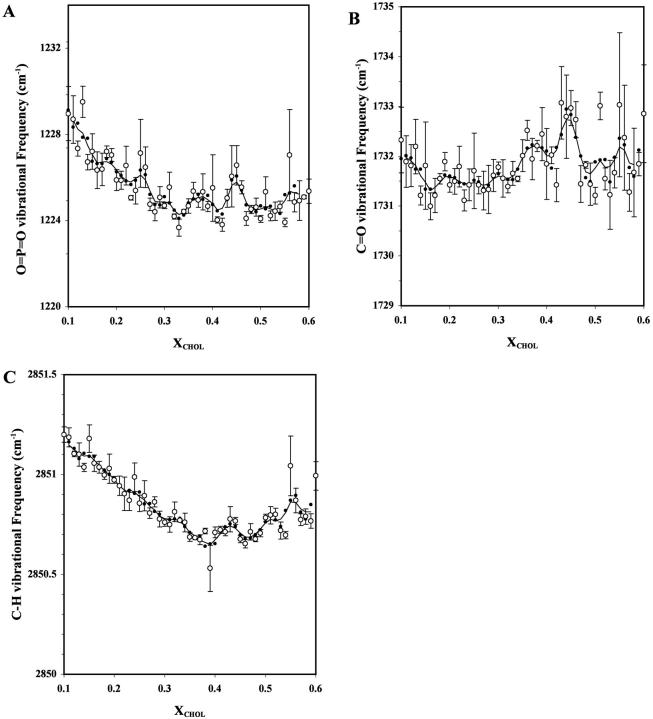
FIGURE 6.
Peak of vibrational frequency band of O=P=O (A), C=O (B), and C-H (C) of POPC in POPC/CHOL bilayers as a function of XCHOL. The measurements were carried out at 23°C and the primary data points are averages of three parallel samples. See the legend of Fig. 1 for other details.

