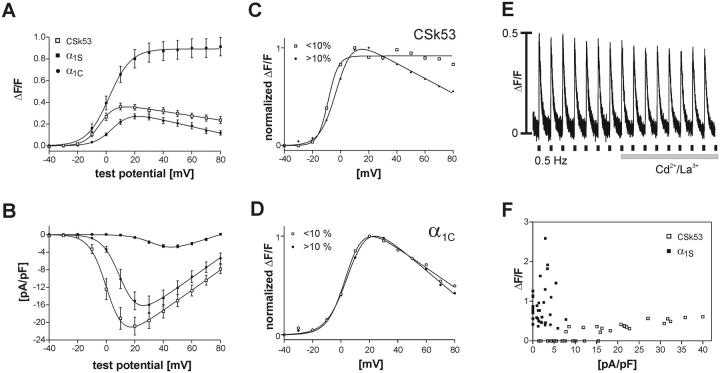
FIGURE 6.
Comparison of the cardiac-skeletal chimera CSk53 with α1C and α1S. The voltage-dependences of Ca2+ transients (A) and of peak current densities (B) of CSk53 (□, n = 18) resemble in size and shape those of GFP-α1C (•) but not those of GFP-α1S (▪). The bell-shaped (cardiac-type) Ca2+ transient-to-voltage curve of CSk53 is in disagreement with skeletal-type EC-coupling properties as indicated by the insensitivity of action potential-induced Ca2+ transients to Cd2+/La3+ block (E). (C) Dividing the CSk53 records into two groups based on the occurrence and magnitude of a fluorescence baseline shift (above and below 10%) shows that the stable recordings (baseline shift < 10%; □, n =7; > 10%, ♦, n = 11) display a sigmoidal transient-to-voltage relationship. (D) In contrast, the transient-to-voltage curves of α1C are bell-shaped regardless of the size of a baseline shift (baseline shift < 10%, C, n = 5; >10%, •, n = 5). Therefore, the bell-shaped appearance of the curve for CSk53 in A is due to this artifact, and the true character of the CSk53 transients is skeletal. (F) A scatter plot of maximal peak current densities versus ΔF/F values emphasizes the difference between Ca2+ transients of CSk53 and GFP-α1S. Whereas current densities for CSk53 vary between 1.5 and 40 pA/pF, the amplitudes of the transients do not exceed ΔF/F values of 0.6.

