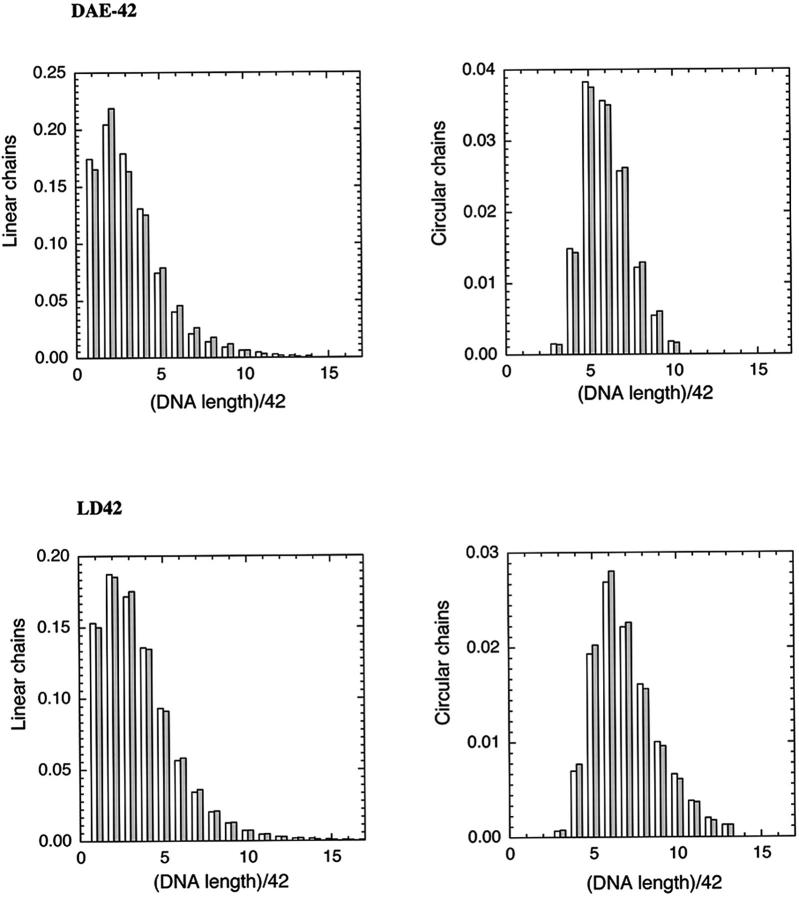
FIGURE 8.
Comparison of experiment and calculations for two systems. The top two panels indicate the fit between observed and calculated proportions of linear and cyclic products of various lengths for the DAE-42 system. The filled bars are experimental results, and the open bars are calculated based on the parameters derived from the analysis. The bottom two panels show the same extent of agreement for the LD-42 molecules.

