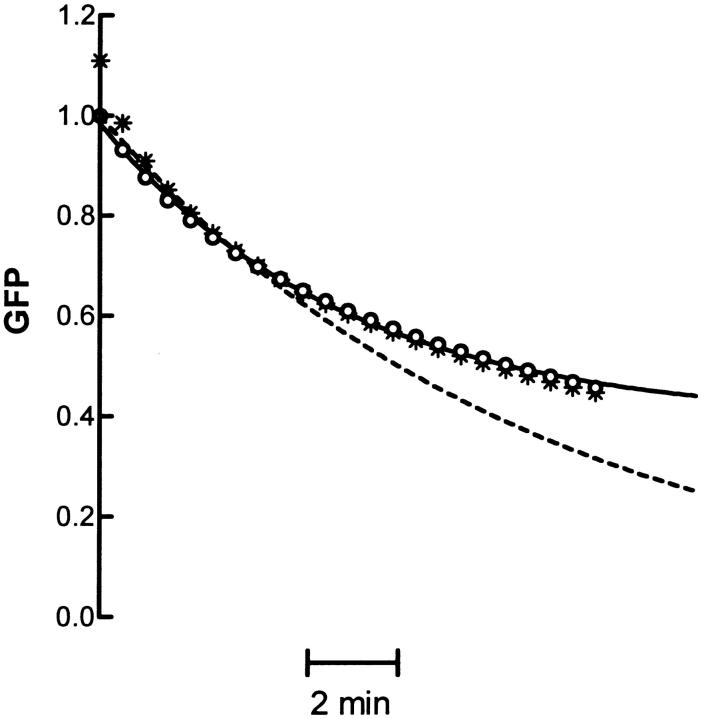
FIGURE 5.
Model of neuropeptide release based on diffusion of secretory vesicles. The open circles show the release time course produced by using the one-term model with the data shown in Fig. 2 A. The solid line shows a fit of the open circles to a single exponential plus a constant. The dashed line shows the time course produced by the first term model for the mean D from the data in Fig. 2 A. The asterisks show the time course produced by using the three-term model.

