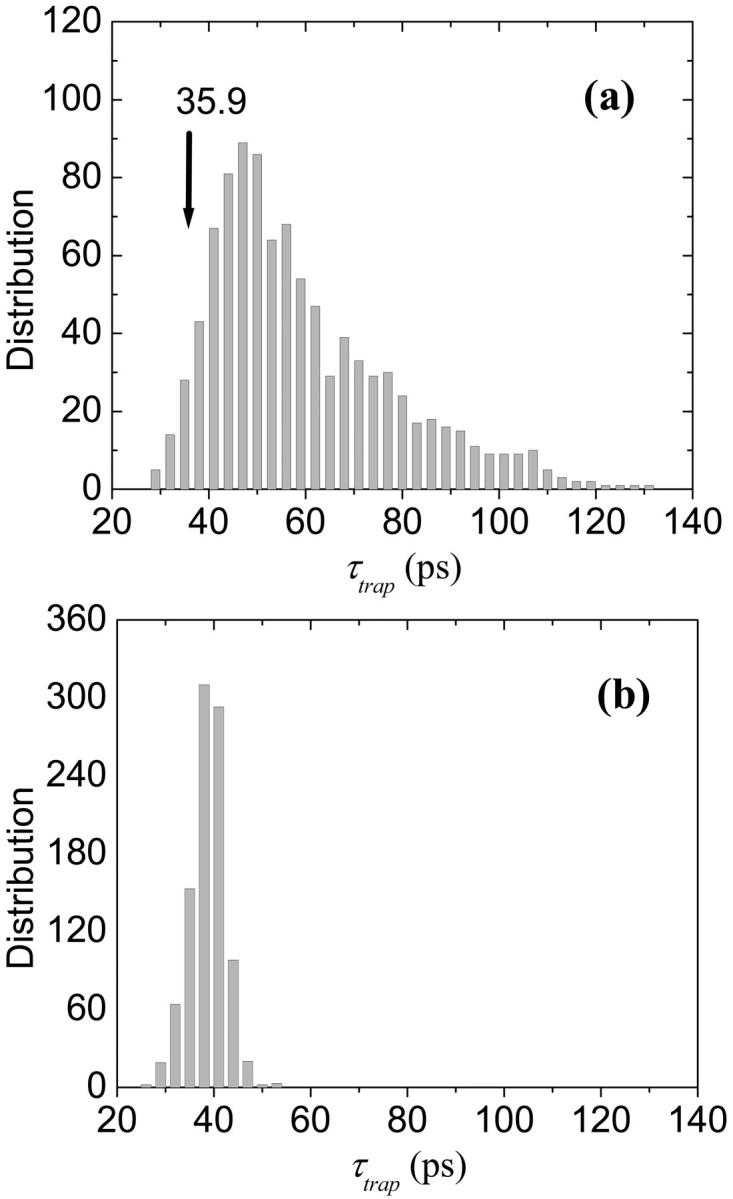
FIGURE 11.

Histogram of trapping times (a) when the energies of all the Chls except P700 are randomly shuffled, and (b) when the energies of the RC and the linkers are fixed to the values calculated in Article I and the other energies are randomly shuffled (1000 samples).
