
FIGURE 4.
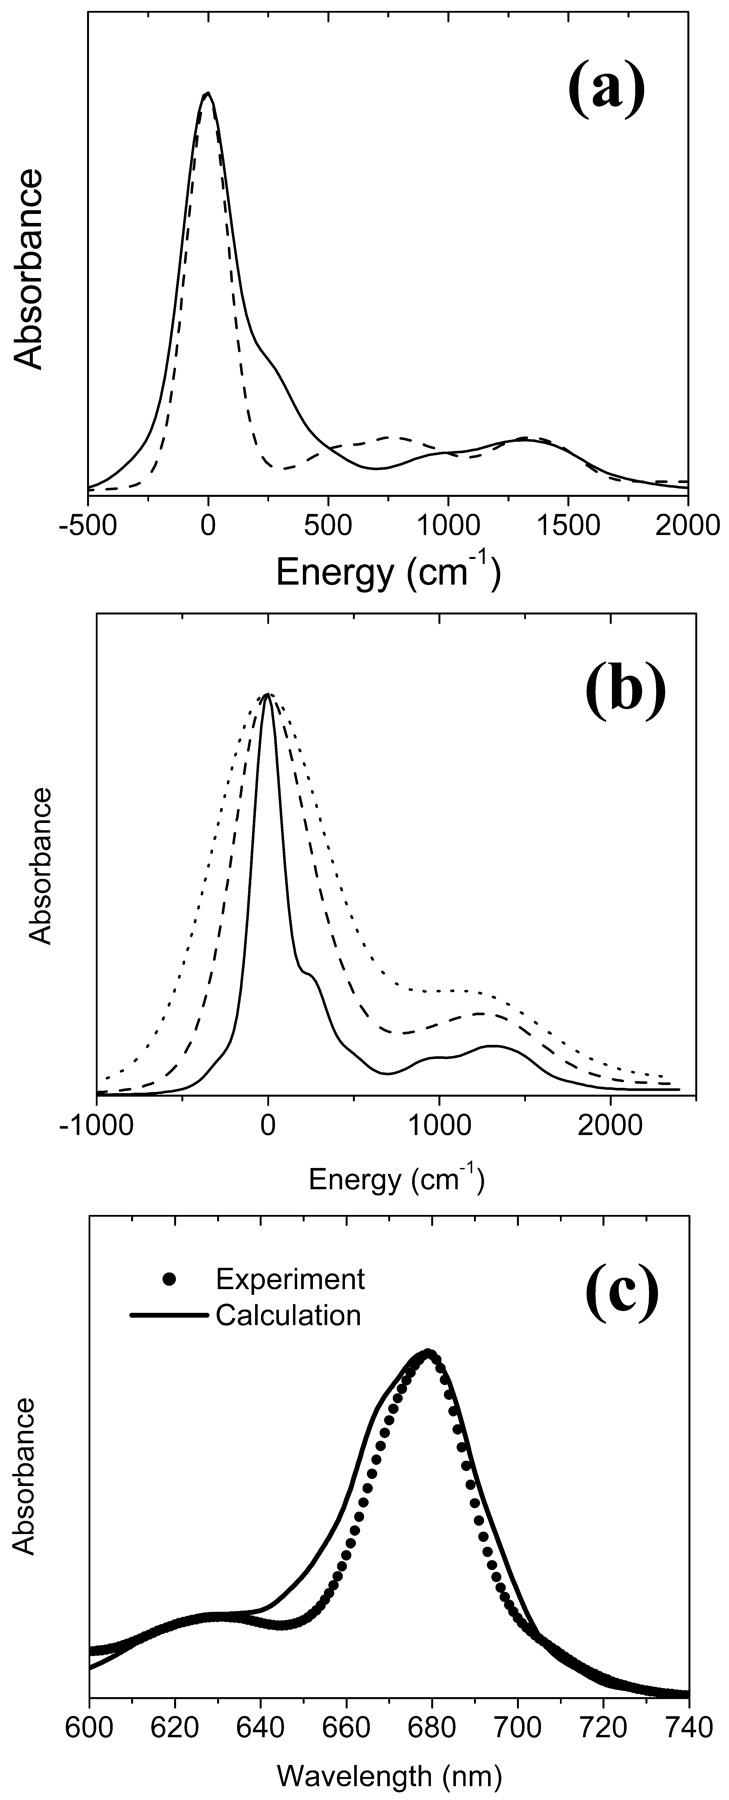
(a) Absorption spectra calculated by the two spectral densities for a Chl a, data from Gillie et al. (1989b) (dashed) and Zucchelli et al. (2002) (solid). (b) Absorption spectra calculated from the three spectral densities for a bulk Chl a (solid), a Chl a with charge transfer character (dashed), and for P700 (dotted). For high frequency modes, the spectral density of Zucchelli et al. (2002) is used. The HR factors and the frequencies are given in Tables 1 and 2. Zero energy in a and b corresponds to the vertical transition energy associated with each spectral density. (c) Comparison of the calculated (solid line) and experimental (solid circles) absorption spectra of the PSI complex at room temperature.