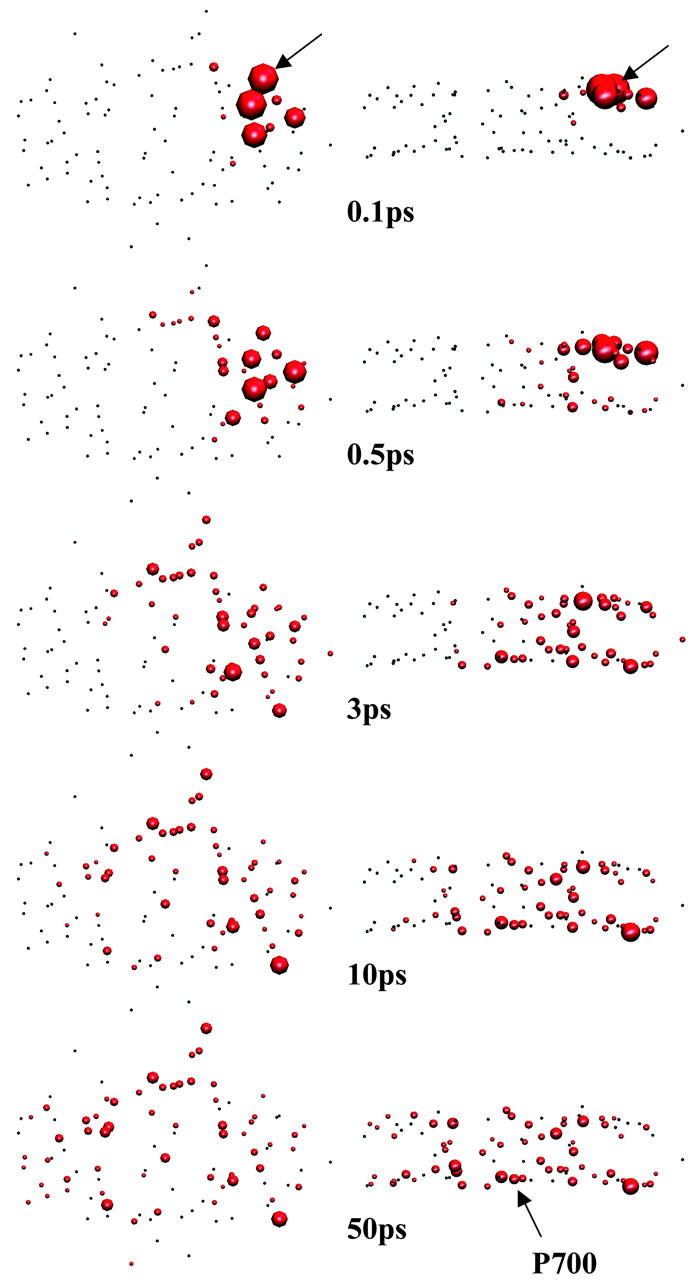
FIGURE 5.

Snapshots of top (left) and side (right) views of the excitation at five times (0.1, 0.5, 3, 10, and 50 ps from top to bottom). Chl PL01 indicated by arrows drawn at 0.1 ps is excited at time zero. The surface area of a sphere is proportional to the population staying at that site normalized by the total population at that time. The arrow drawn on the side view at 50 ps shows the location of P700. The charge transfer time at P700 is 1 ps for these figures.
