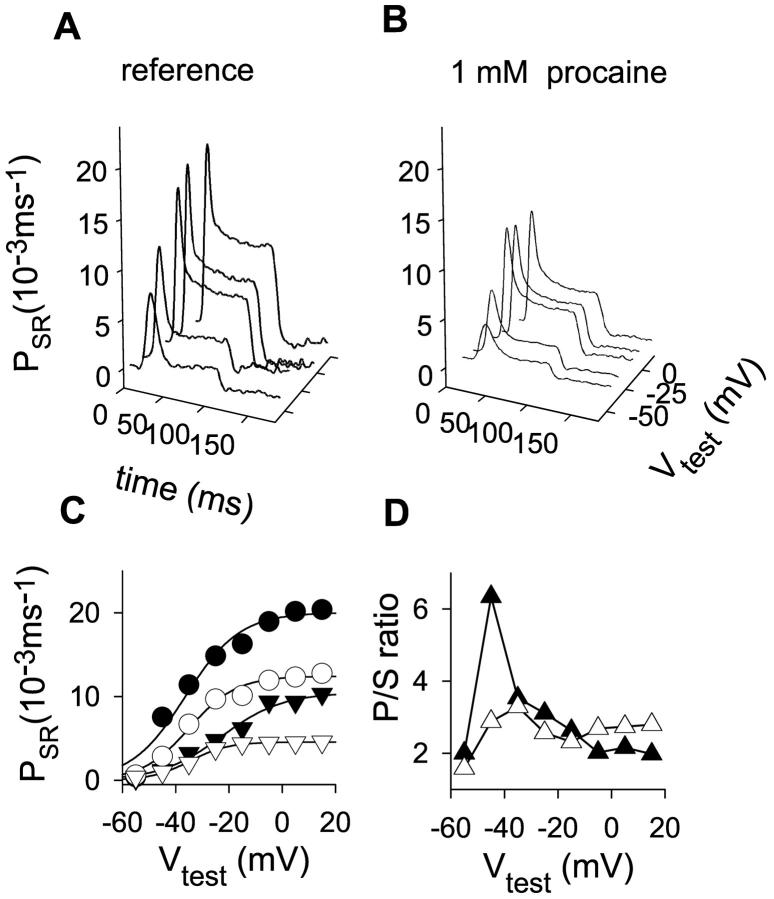
FIGURE 3.
Effect of 1 mM procaine on kinetic terms of Ca2+ release permeability and their ratio. (A) Corrected release records obtained in a stretched L. ocellatus with 1 mM EGTA in the internal solution. (B) Release records at the same voltages after 1 mM procaine. Fiber 412. [APIII] ranged from 0.75 to 1.11 mM; time elapsed was 21 min. Initial Ca content of the SR was 1600 μM both in reference and in procaine. Parameters of removal, [EGTA] = 1.08 mM, koffEGTA = 3 μM−1 s−1, konEGTA = 2.46 s−1, maximum pump rate = 0.46 mM−1 s−1, and [Parvalbumin] = 2.96 mM, 50 nM free Ca2+. (C) Voltage dependence of both kinetic components of corrected release waveforms. The black symbols correspond to the reference values (peak permeability, circles; steady permeability, triangles), and the unfilled symbols are in the presence of 1 mM procaine. One-Boltzmann function fits to the data points (continuous lines). Parameters of the Boltzmann fit to the averages, PSRmax = 20.02 × 10⁻³ ms−1, V* = 36.36 mV, and k = 10.18 mV for the peak permeability in reference; PSRmax = 10.47 × 10⁻³ ms−1, V* = −22.77 mV, and k = 11.45 mV for the steady SR permeability in reference; PSRmax = 12.42 × 10⁻³ ms−1, V* = −34.95 mV, and k = 8.83 mV; and PSRmax = 4.57 × 10⁻³ ms−1, V* = 34.7 mV, and k = 7.2 mV for the same quantities in 1 mM procaine. (D) Ratios of peak/steady permeability. Solid symbols are in reference; and unfilled symbols in 1 mM procaine.

