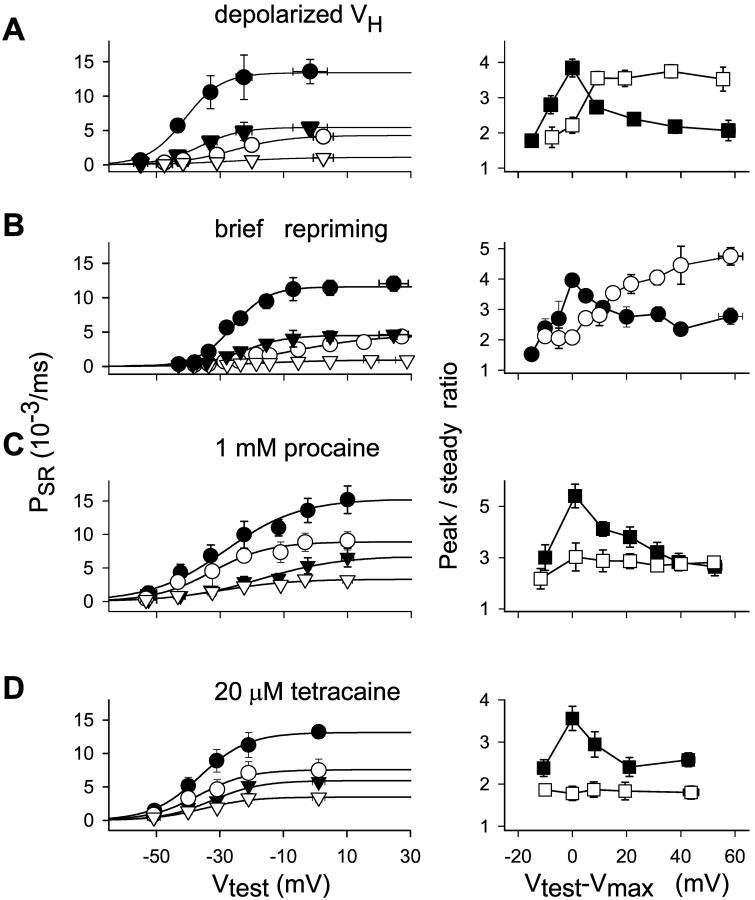
FIGURE 5.
Effect of three interventions on peak and steady components of Ca2+ release flux permeability and their ratio. (A) Depolarized holding potential. Left, Data points (mean ± SE) in seven slack fibers from R. catesbeiana. Peak permeability values (circles) in reference (solid) or at depolarized HP (unfilled). Corresponding steady values (triangles). Curves traced with Eq. 3 fitted to the averaged data. Fit parameters, PSRmax = 13.17 × 10⁻³ ms−1, V* = 27.6 mV, and k = 7.89 mV for the peak permeability in reference; PSRmax = 5.33 × 10⁻³ ms−1, V* = −25.35 mV, and k = 7.09 mV for the steady SR permeability in reference; PSRmax = 4.8 × 10⁻³ ms−1, V* = −33.63 mV, and k = 7.25 mV; and PSRmax = 1.54 × 10⁻³ ms−1, V* = −16.82 mV, and k = 11.63 mV for the depolarized HP. Right, Peak/steady ratio in reference (solid) or at depolarized HP (unfilled). Test voltages in the abscissa are shifted by the value at which the maximum was observed in each fiber (Vtest − Vmax). (B) Brief repriming. Left, Data points (mean ± SE) obtained in four slack fibers from R. catesbeiana. Peak permeability values (circles) in reference (filled) or at depolarized HP (unfilled). Corresponding steady values (triangles). Fit parameters, PSRmax = 11.6 × 10⁻³ ms−1, V* = −26.1 mV, and k = 5.54 mV for the peak permeability in reference; PSRmax = 4.50 × 10⁻³ ms−1, V* = −22.65 mV, and k = 6.63 mV for the steady SR permeability in reference; PSRmax = 4.35 × 10⁻³ ms−1, V* = −8.18 mV, and k = 12.36 mV; and PSRmax = 0.92 × 10⁻³ ms−1, V* = −17.47 mV, and k = 11.54 mV for the brief repriming protocol. Right, Peak/steady ratio in reference (solid) or after brief repriming (unfilled). (C) Procaine. (Left) Data points (mean ± SE) obtained in four stretched fibers from L. ocellatus. Peak permeability values (circles) in reference (filled) or 1 mM procaine (unfilled). Corresponding steady values (triangles). Fit parameters, PSRmax = 15.3 × 10⁻³ ms−1, V* = −28.82 mV, and k = 12.72 mV for the peak permeability in reference; PSRmax = 6.87 × 10⁻³ ms−1, V* = −16.47 mV, and k = 12.69 mV for the steady SR permeability in reference; PSRmax = 9.03 × 10⁻³ ms−1, V* = −32.69 mV, and k = 10.26 mV; and PSRmax = 3.23 × 10⁻³ ms−1, V* = −30.18 mV, and k = 10.48 mV in 1 mM procaine. Right, Peak/steady ratio in reference (solid) or procaine (unfilled). (D) Tetracaine. Left, Averages (mean ± SE) from six slack fibers from R. catesbeiana with same internal solution as in A. Peak permeability values (circles) in reference (solid) or 20 μM tetracaine (unfilled). Corresponding steady values (triangles). Fit parameters, PSRmax = 13.07 × 10⁻³ ms−1, V* = −36.74 mV, and k = 6.51 mV for the peak permeability in reference; PSRmax = 5.64 × 10⁻³ ms−1, V* = −33.52 mV, and k = 6.88 mV for the steady SR permeability in reference; PSRmax = 7.56 × 10⁻³ ms−1, V* = −36.51 mV, and k = 7.7 mV; and PSRmax = 3.49 × 10⁻³ ms−1, V* = −35.29 mV, and k = 7.8 mV for the same quantities in 20 μM tetracaine. Right, peak/steady ratio in reference (solid) or tetracaine (unfilled). In all graphs, points from proximate voltages (10-mV intervals) were averaged and ascribed to the mean voltage. Internal solutions had 5 mM EGTA in A, B, and D, and 1 mM in C. Nominal [Ca2+] was 50 nM.

