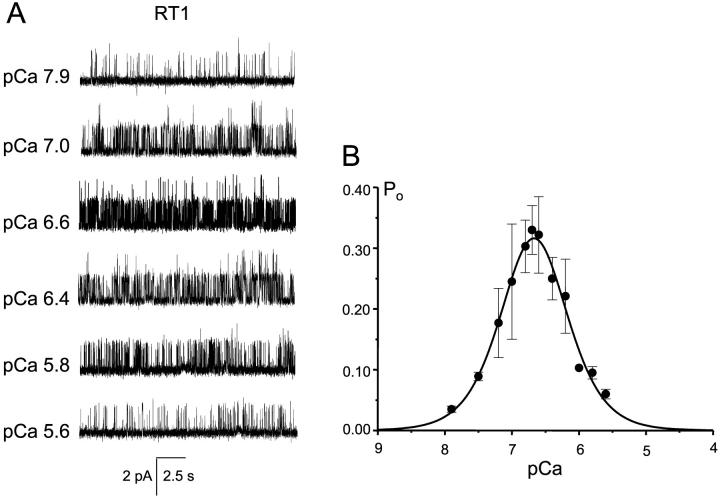
FIGURE 7.
RT1 Ca2+ dependence. (A) The current recordings of RT1 from the same experiment at different Ca2+ concentrations as indicated. (B) Bell-shaped Ca2+ dependence of the RT1 channels. The data from independent experiments were averaged together at each Ca2+ concentration as described in Methods, and shown as mean ± SE (n = 4; filled circles). The averaged data were fitted by the bell-shaped equation modified from Bezprozvanny et al. (1991) as explained in Methods. The parameters of optimal fit (smooth curve) are in Table 1.

