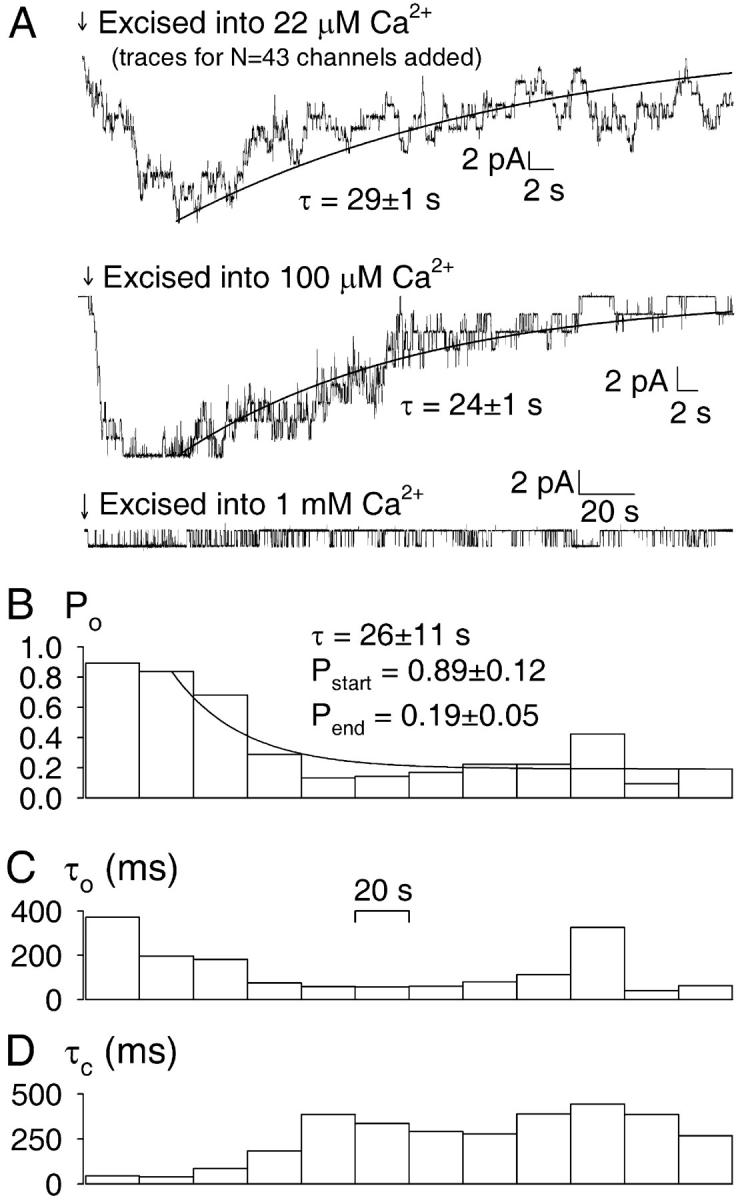
FIGURE 4.

Time courses of deactivation of CA-NSC channels excised into various [Ca2+]. (A) (Top) Summed current traces from patches excised into ∼20 μM Ca2+, representing a total of 43 channels. Traces were synchronized around the time point of excision (arrow). (Center) Current trace from a patch with nine channels excised (arrow) into 100 μM Ca2+. Both decay time courses were fitted with decaying exponentials (solid lines). (Bottom) Current trace of a single CA-NSC channel excised (arrow) into 1 mM Ca2+. B, C, D, Stability plots illustrating Po (B), mean open time (C), and mean closed time (D) analyzed over a moving 20-s time window for the bottom trace shown in A. After exclusion of the first 20-s segment the Po time course in B was tentatively fit by an exponential relaxing to a new steady state (solid line).
