FIGURE 5.
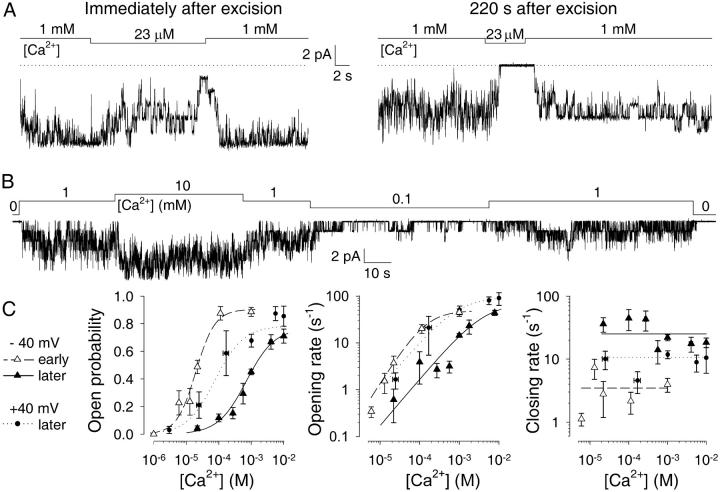
Deactivation decreases the apparent affinity of CA-NSCs for Ca2+. (A) Test applications of ∼20 μM Ca2+ in the same patch a few seconds (left) and ∼3 min (right) after patch excision. Dotted line marks zero-current level. (B) Current record from a patch with six CA-NSC channels superfused with various [Ca2+]. Trace starts ∼4 min after excision. (C) Kinetics of deactivated channels. Plots of Po (left), opening rate (center), and closing rate (right) as a function of [Ca2+]i assayed at −40 mV (▴) or +40 mV (•) membrane potential. Plots of Po and opening rate were fitted (solid and dotted lines) with the Michaelis-Menten equation and yielded parameters Po,max = 0.77 ± 0.06, Km = 0.71 ± 0.15 mM at −40 mV, Po,max = 0.78 ± 0.05, and Km = 79 ± 39 μM at +40 mV for open probability; rCO,max = 72 ± 10 s−1, Km = 4.2 ± 1.0 mM at −40 mV; rCO,max = 97 ± 21 s−1; and Km = 0.88 ± 0.55 mM at +40 mV for opening rate. Average closing rates over the whole range of [Ca2+]i were 25 ± 2 s−1 at −40 mV, and 11 ± 1 s−1 at +40 mV. For comparison, corresponding plots and fits for freshly excised channels at −40 mV are replotted from Fig. 3, A–C (▵, dashed lines). Numbers of experiments and statistics: n = 11, 17, 13, 9, 129, 20, and 12, respectively, for [Ca2+]i = 22, 100, 270, 560 μM, 1 mM, 4.1 mM, and 10 mM (−40 mV); n = 2, 8, 6, 26, 5, and 4, respectively, for [Ca2+]i = 3, 25, 170 μM, 1 mM, 5.6 mM, and 10 mM (+40 mV). pKm for stimulation of Po increased significantly during deactivation (p < 0.00001), decreased significantly upon depolarization to +40 mV (p = 0.00001), but remained significantly higher than immediately after excision (p = 0.04). Average closing rate (log(rOC)) was significantly accelerated by deactivation (p < 0.00001), significantly slowed by depolarization (p = 0.005), but remained significantly faster than immediately after excision (p = 0.00008).

