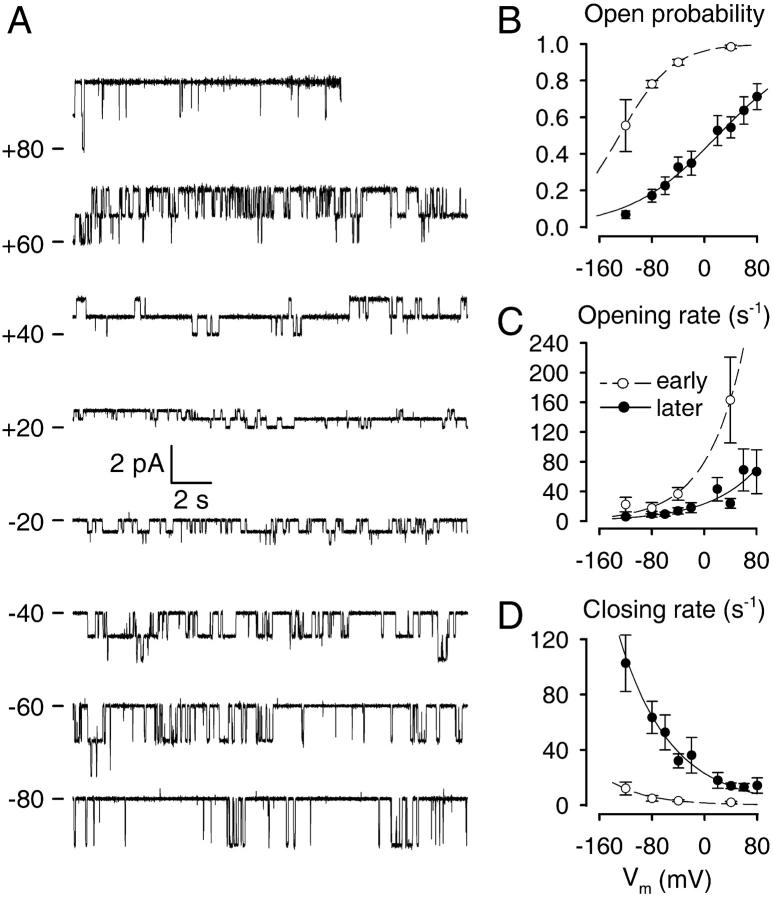
FIGURE 6.
Voltage-dependent gating of CA-NSCs. (A) 20-s current traces of two CA-NSC channels in a patch bathed in symmetrical 140 mM NaCl and 1 mM Ca2+ on the cytoplasmic side, at membrane potentials ranging from −80 to +80 mV. Traces start >10 min after patch excision; the seal was lost toward the end of the +80-mV segment. Plots of Po (B), mean opening rate (C), and mean closing rate (D) as a function of membrane voltage (Vm) in 1 mM Cai2+ for deactivated channels (•) or early after patch excision (○). Po plots (B) were fitted with the Boltzmann equation (see Methods) and yielded an effective gating charge z = 0.4 ± 0.1 and half-maximally activating voltage V1/2 = 20 ± 7 mV for deactivated channels (solid line), and z = 0.6 ± 0.1, V1/2 = −129 ± 10 mV immediately after excision (dashed line). Plots of mean opening and closing rate (C, D) were fitted with exponentials (see Methods). Fit parameters for opening rate (C) were z = 0.7 ± 0.2, rCO(0) = 23 ± 7 s−1 for deactivated channels, and z = 0.9 ± 0.2, rCO(0) = 79 ± 15 s−1 immediately after excision. Fit parameters for closing rate (D) were z = 0.7 ± 0.1, rOC(0) = 23 ± 4 s−1 for deactivated channels, and z = 0.9 ± 0.3, rCO(0) = 1.5 ± 0.8 s−1 immediately after excision. Numbers of experiments and statistics: n = 7, 21, 17, 20, 11, 12, 16, 14, and 13, respectively, for Vm = −120, −80, −60, −40, −20, +20, +40, +60, and +80 mV (deactivated channels); and n = 4, 4, 11, and 5, respectively, for Vm = −120, −80, −40, and +40 mV (immediately after excision). The shift in V1/2 upon deactivation was significant (p < 0.00001).

