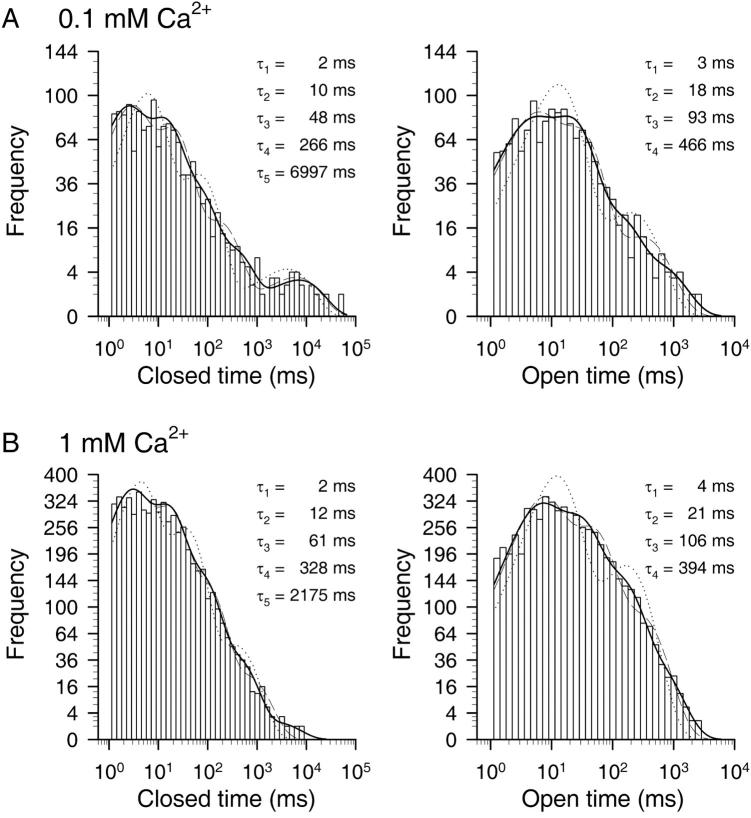
FIGURE 7.
Ca2+-dependence of dwell-time distributions. (A and B) Dwell-time histograms of closed (left) and open (right) dwell times of single CA-NSC channels at −40 mV membrane potential in 0.1 mM (A) and 1 mM (B) Cai2+. Events were binned at 10 bins per decade; ordinate is square-root transformed. Dead time was 1 ms, events were pooled from eight patches, and fitted to distributions with four (open times) or five (closed times) exponential components using maximum likelihood (solid lines; see Methods). Fit parameters were: 0.1 mM Ca2+: τc1 = 1.7 ± 0.2 ms, τc2 = 10 ± 0.7 ms, τc3 = 48 ± 4 ms, τc4 = 266 ± 37 ms, τc5 = 6997 ± 1420 ms, ac1 = 0.36 ± 0.03, ac2 = 0.38 ± 0.04, ac3 = 0.19 ± 0.02, ac4 = 0.057 ± 0.009, ac5 = 0.016 ± 0.002, τo1 = 2.9 ± 0.4 ms, τo2 = 18 ± 1 ms, τo3 = 93 ± 11 ms, τo4 = 466 ± 68 ms, ao1 = 0.32 ± 0.03, ao2 = 0.51 ± 0.05, ao3 = 0.13 ± 0.02, and ao4 = 0.040 ± 0.004. 1 mM Ca2+: τc1 = 2.0 ± 0.1 ms, τc2 = 12 ± 0.4 ms, τc3 = 61 ± 3 ms, τc4 = 328 ± 20 ms, τc5 = 2175 ± 613 ms, ac1 = 0.36 ± 0.02, ac2 = 0.37 ± 0.02, ac3 = 0.21 ± 0.01, ac4 = 0.059 ± 0.004, ac5 = 0.0025 ± 0.0001, τo1 = 4.2 ± 0.2 ms, τo2 = 21 ± 0.8 ms, τo3 = 106 ± 4 ms, τo4 = 394 ± 23 ms, ao1 = 0.33 ± 0.02, ao2 = 0.38 ± 0.02, ao3 = 0.23 ± 0.01, and ao4 = 0.063 ± 0.003. Also shown are the best fits to closed- and open-time distributions using three or four, and two or three exponential components, respectively (dotted and dashed lines).

