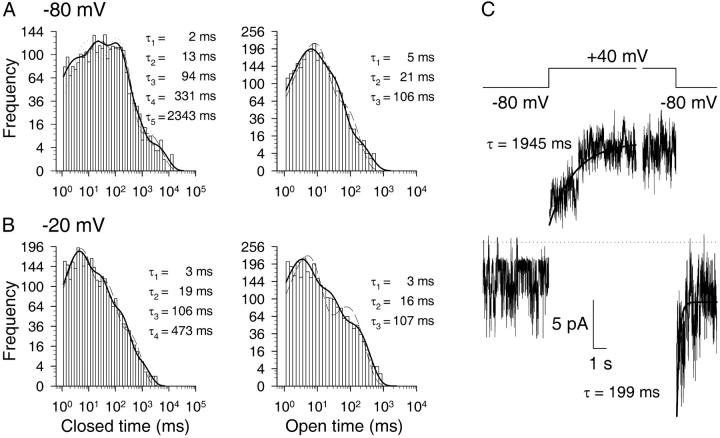
FIGURE 8.
Voltage-dependence of dwell-time distributions and time course of voltage-dependent activation. (A and B) Dwell-time histograms of closed (left) and open (right) dwell times of single CA-NSC channels at −80 (A) and −20 mV (B) membrane potentials in 1 mM Cai2+. Dead time was 1 ms; events from six patches were pooled. Closed-time distributions at −80 and −20 mV were fit by five and four exponential components, respectively; open times were fit by three components. Fit parameters were: −80 mV: τc1 = 1.9 ± 0.2 ms, τc2 = 13 ± 1 ms, τc3 = 94 ± 4 ms, τc4 = 331 ± 29 ms, τc5 = 2343 ± 348 ms, ac1 = 0.19 ± 0.02, ac2 = 0.29 ± 0.02, ac3 = 0.39 ± 0.03, ac4 = 0.11 ± 0.01, ac5 = 0.020 ± 0.002, τo1 = 4.5 ± 0.3 ms, τo2 = 21 ± 0.8 ms, τo3 = 106 ± 10 ms, ao1 = 0.50 ± 0.03, ao2 = 0.45 ± 0.03, and ao3 = 0.055 ± 0.004. −20 mV: τc1 = 3.3 ± 0.2 ms, τc2 = 19 ± 1 ms, τc3 = 106 ± 6 ms, τc4 = 473 ± 56 ms, ac1 = 0.45 ± 0.03, ac2 = 0.34 ± 0.03, ac3 = 0.18 ± 0.01, ac4 = 0.029 ± 0.002, τo1 = 2.7 ± 0.1 ms, τo2 = 16 ± 0.8 ms, τo3 = 107 ± 5 ms, ao1 = 0.52 ± 0.03, ao2 = 0.32 ± 0.02, and ao3 = 0.16 ± 0.009. Also shown are the best fits to closed-time distributions using three or four exponential components for −80 mV (dotted and dashed lines) and three components for −20 mV (dashed line), as well as the best fits to open-time distributions using two components (dashed lines). (C) Baseline-subtracted, synchronized currents recorded in response to voltage jumps from −80 mV to +40 mV and vice versa were added up from five and nine patches, respectively, containing a total of 14 channels in each case. Cai2+ was 1 mM. Time courses of activating and inactivating currents were fitted (solid lines) by single exponentials (see Methods). Dotted line shows zero-current level.

