
FIGURE 4.
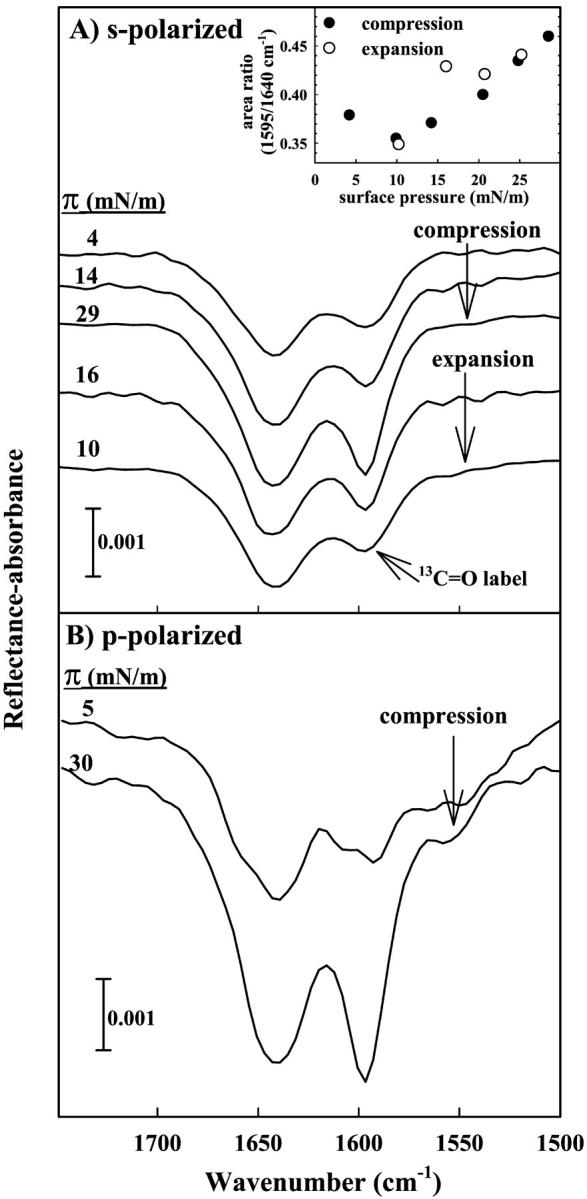
IRRAS spectra of the Amide I region acquired for *SP-B9–36 on a D2O subphase. (A) Spectra are acquired using s-polarization and surface pressure values are noted from top to bottom during compression and subsequent expansion of the monolayer. The inset displays the pressure dependence of the relative area of the curve fit 1597 and 1640 cm−1 Amide I band components during intermittent compression (•) and expansion (○) of the film. (B) Spectra acquired using p-polarized radiation during the compression of an *SP-B9–36 peptide monolayer.