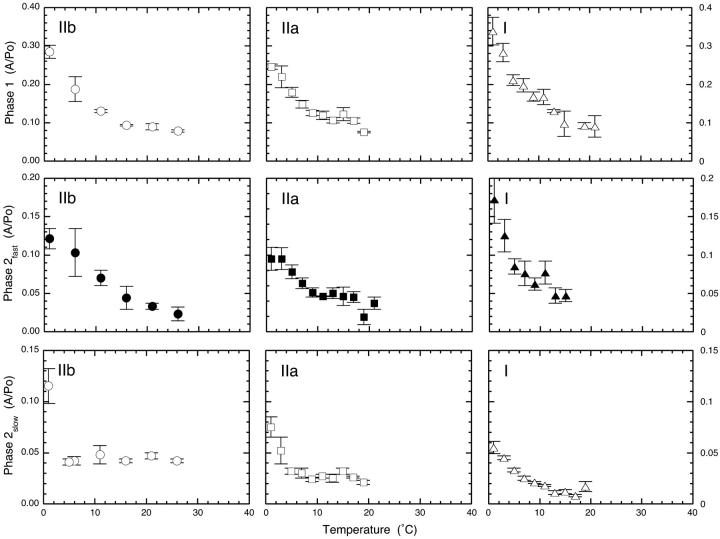
FIGURE 3.
Temperature dependencies of the normalized amplitudes of phases 1, 2fast, 2slow in fast, medium speed, and slow fibers. The amplitude of phase 1, normalized (relative) to isometric tension at the temperature of the experiment, declines with increasing temperature to show that isometric tension increases more than stiffness as temperature is raised. The form (shape) and magnitude is similar in each panel irrespective of fiber type. Phase 2fast versus temperature data resembles phase 1 save that the amplitudes are reduced ∼twofold, a relationship explored in Fig. 4. Phase 2slow amplitude versus temperature data is different. In fast, but also in medium speed fibers, normalized amplitudes are constant at 5°C and higher temperatures. However, in slow fibers the response is different and normalized tension does not plateau, but declines with increasing temperature. Data from between three and eight individual fibers were averaged at each temperature. Error bars are SE.

